Fort Bend County has routinely had some of the largest property taxes in Texas. For many years, they were the No.1 county in the Lone Star State when it came to being overtaxed. While they have been superseded by a few other counties, notably Travis, Fort Bend continues to see plenty of aggressive action from the Fort Bend Central Appraisal District (FBCAD). This adversarial nature between citizens and FBCAD has created a unique situation when it comes to changing property values every year.
Over one-third of Fort Bend property owners protest their taxes every year. While other parts of the state are starting to come around to the idea of appeals, Fort Bend has been a leader in the field for decades. With some of the most effective property tax appeals in the entire nation, Fort Bend County is a paragon that many inflated counties should aspire to be. 2025 was no different, and after FBCAD handed out high values again, it took taxpayers little time to respond. O’Connor will discuss how impactful Fort Bend property tax appeals have been so far, with the informal period over and formal hearings before the Appraisal Review Board (ARB) just starting.
Fort Bend Residential Protests Slice Value Rises Nearly in Half
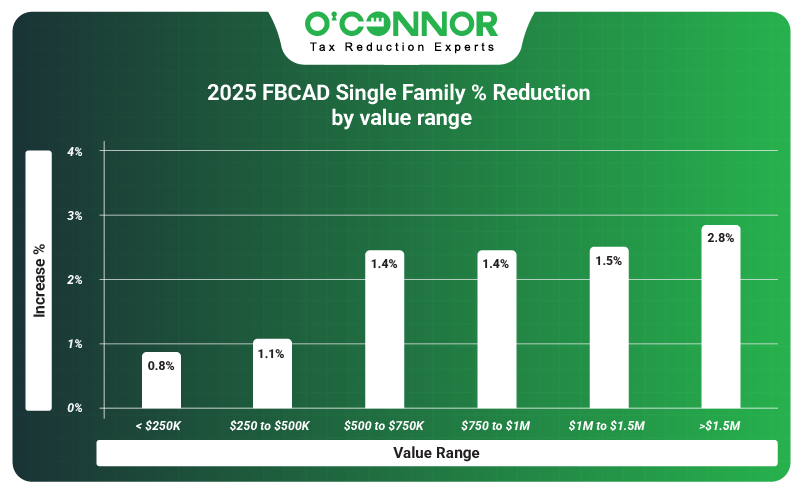
At the start of 2025, FBCAD tallied the total market value of residential property in Fort Bend County as $126.22 billion, an increase of 3.3%. This was tame by Fort Bend County standards but was met with the typical fusillade of appeals anyway. With only informal appeals in the books, taxpayers have already saved 1.3% of their taxable value. Homes worth between $250,000 and $500,000 are the largest pool of residential value, and managed to land a cut of 1.1%, roughly $622.20 million. The No. 2 spot went to homes worth $500,000 to $750,000, which saved 1.4%. Homes worth over $1.5 million had seen an increase of a staggering 13.5% but managed to get a decrease of 2.8% to offset things somewhat.
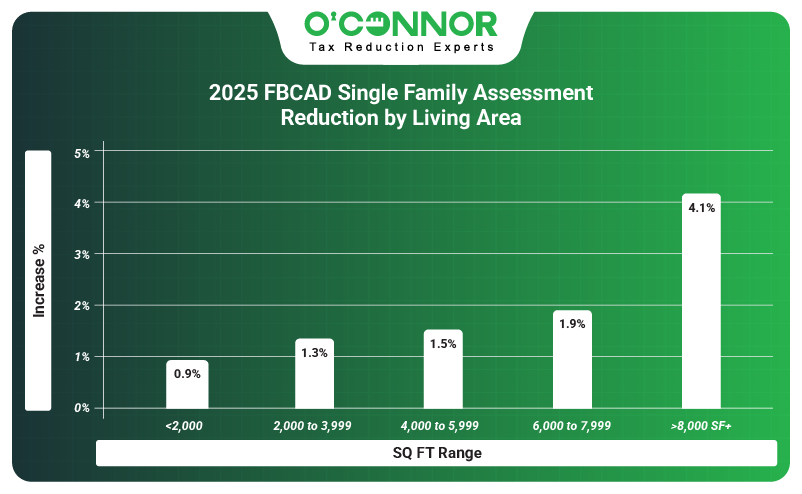
It is easy to pick out the typical home size in Fort Bend County when you compare it to the collective value. Homes between 2,000 and 3,999 square feet totaled an estimated $79.20 billion. Representing over half of all residential value, the 1.3% cut these homes received had the biggest impact on the bottom line. Homes ranging from 4,000 to 5,999 square feet were in second place and nabbed a cut of 1.5%. The smallest homes received the smallest reduction, with residences under 2,000 square feet netting a drop of 0.9%. Conveniently, the biggest homes also got the largest cut by percentage, nabbing a reduction of 4.1%.
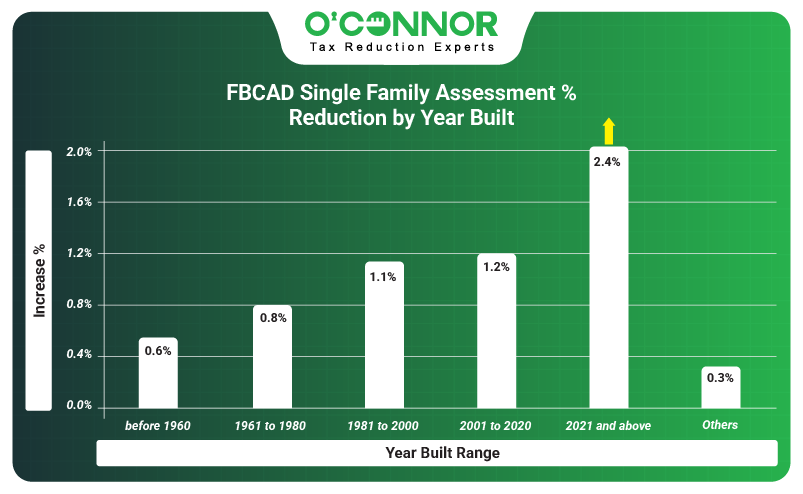
The entire Houston area has been in a growth spurt and construction boom since 2000 and Fort Bend is a perfect representation of this. 59% of all home value was created between 2001 and 2020, while 12% comes from new construction. Though they are the primary targets of FBCAD, these two categories were still able to achieve net reductions of 1.2% and 2.4% respectively. Homes built between 1981 and 2000 were responsible for 22% of value and managed to get reductions totaling 1.1%.
Fort Bend Businesses Counter 16.4% Rise with 6.1% Reduction
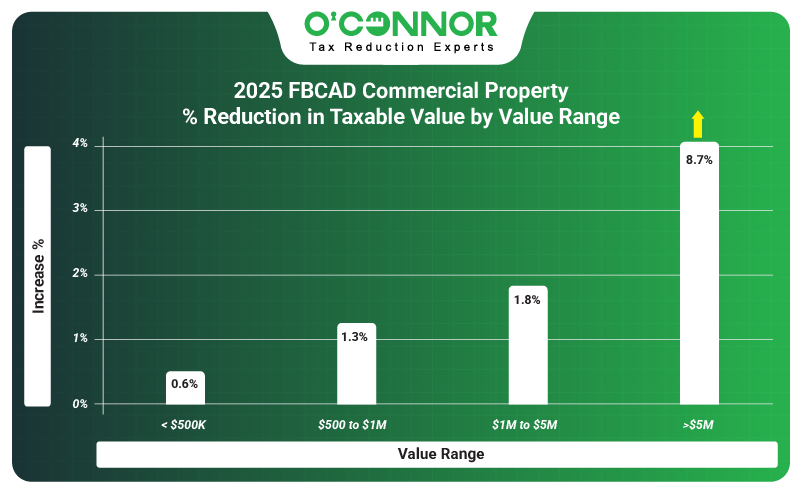
While Fort Bend has a reputation as a residential hot spot, commercial property has been on a huge upswing. In 2025 alone, FBCAD estimated that all commercial property had increased 16.4% to a combined total of $22.73 billion. Business owners were quick to hit back and used informal appeals to get a reduction of 6.1%. Over half of all business value was created from businesses worth more than $1.5 million. These big commercial properties managed to get a reduction of 8.7%, the largest in percentage and value. Commercial properties in the range of $1 million to $1.5 million got a solid 1.8% cut.
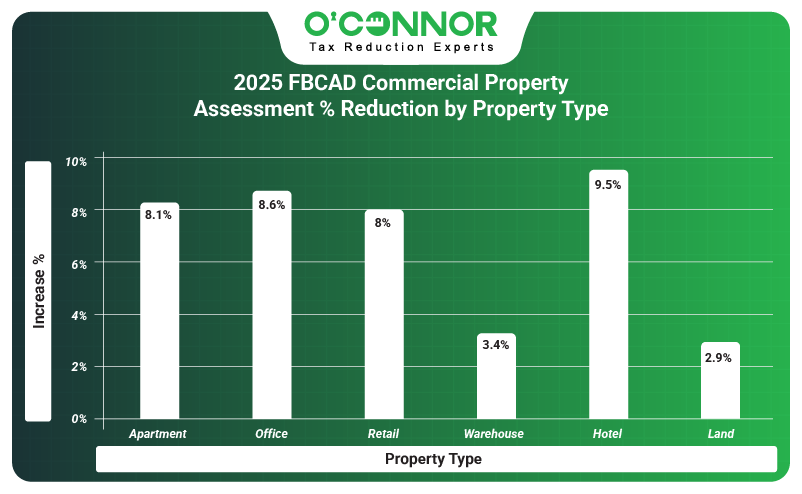
Befitting a residential community, apartments were the No. 1 commercial property in Fort Bend County. Initially valued at $5.66 billion, multifamily homes were protested down8.1% to $5.20 billion in value. Retail, the second-place commercial property type, got a reduction of 8%, while offices achieved a solid cut of 8.6%. Hotels saw their taxable value skyrocket by 48% in 2025 yet managed to cushion the blow a bit with a decrease of 9.5% thanks to appeals.
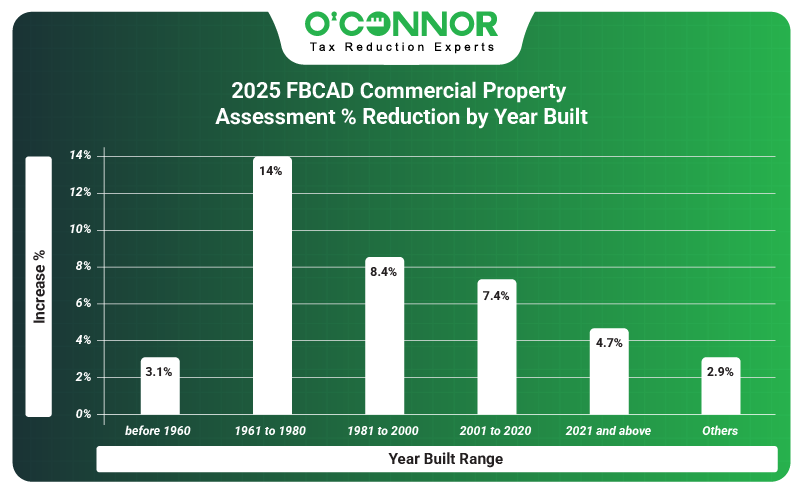
The pattern of boom-era construction established by homes holds true for commercial property as well. 42% of all commercial properties have their origins in the period of 2001 to 2020, if only the contribution to total value is considered. This subset of properties managed to save 7.4% thanks to appeals, netting the largest return of value. 1981 to 2000 was the next in line for total value and got a reduction of 8.4%. New construction managed to become the No.3 source of value in 2025, accounting for 7% of all value, while also seeing a reduction of 4.7%.
Protests Help Apartments Come Back from Large Spike
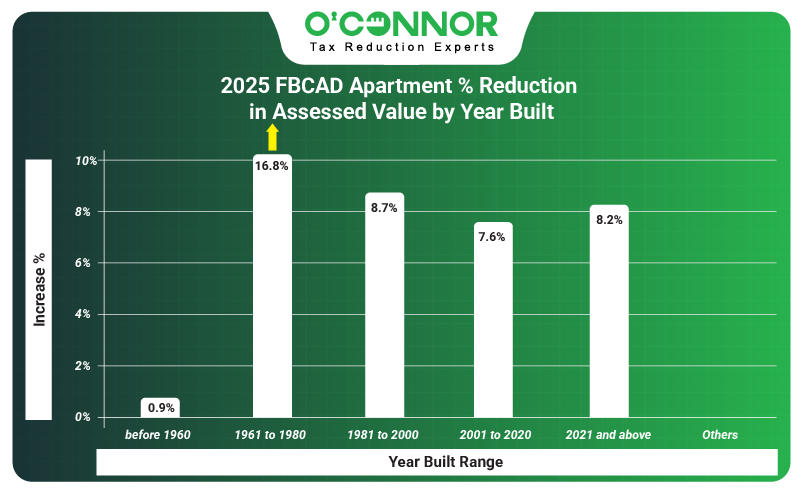
While hotels got the largest hit from FBCAD by percentage, it was apartments that saw the largest rise in their taxable value. The value of apartments shot up 19.3%, going from $4.67 billion to $5.57 billion. This is obviously a threat to both owners and renters. After a quick deployment of appeals, these values were cut almost in half, with a reduction of 8.1% to the total. Apartments built between 2001 and 2020 represented 74% of all value and their decrease of 7.6% set the tone for the whole county. The second and third-largest blocks, those built between 1981 and 2000 and new construction, saved 8.7% and 8.2% respectively. Though small in number, apartments constructed from 1961 to 1980 saw a huge cut of 16.8%.
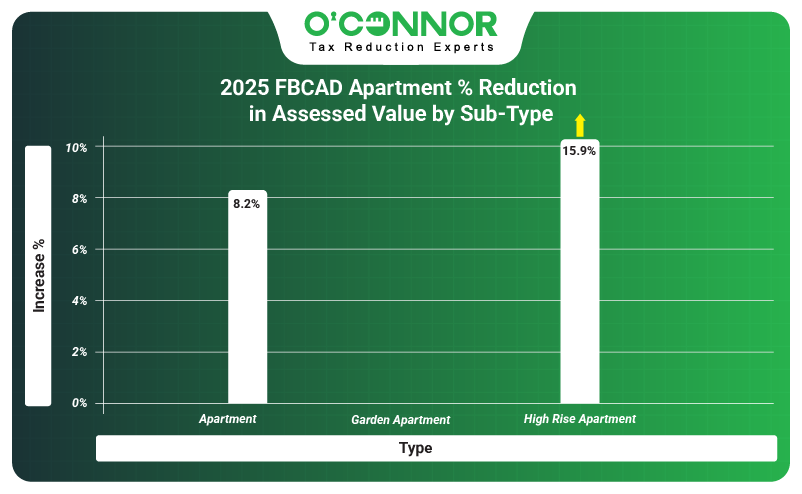
FBCAD only tracks apartments as three subtypes. The largest of these are generic apartments, as they act as a catch-all for everything that does not fit elsewhere. The apartment category totaled $5.55 billion in value, before being cut down 8.2% by appeals. Garden apartments were valued at $83.14 million and were an aberration in that they saw no savings. High-rise apartments contributed only $26.89 million but saw a decrease of 15.9%.
Offices Save 8.6% Thanks to Appeals
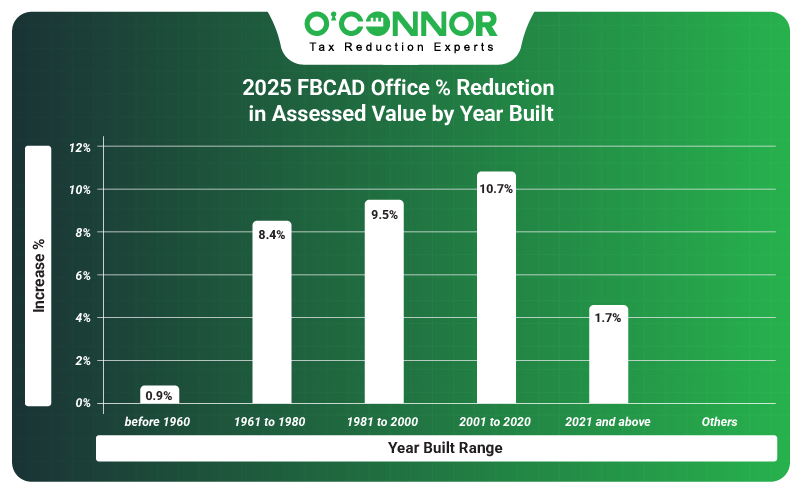
The owners of office properties were properly slammed by FBCAD in 2025, with the total taxable value going from $2.355 billion to $2.912 billion, an increase of 23.7%. Protests managed to get this spike cut by around a third thanks to owners practicing their rights. 49% of all office value was built between 2001 and 2020, and this was also the largest beneficiary of appeals, seeing a cut of 10.7%. Like other properties, the No. 2 category for value was offices built between 1981 and 2000. These offices landed a smaller reduction of 9.5%. New construction was in the No.3 position and had a small decrease of 1.7%.
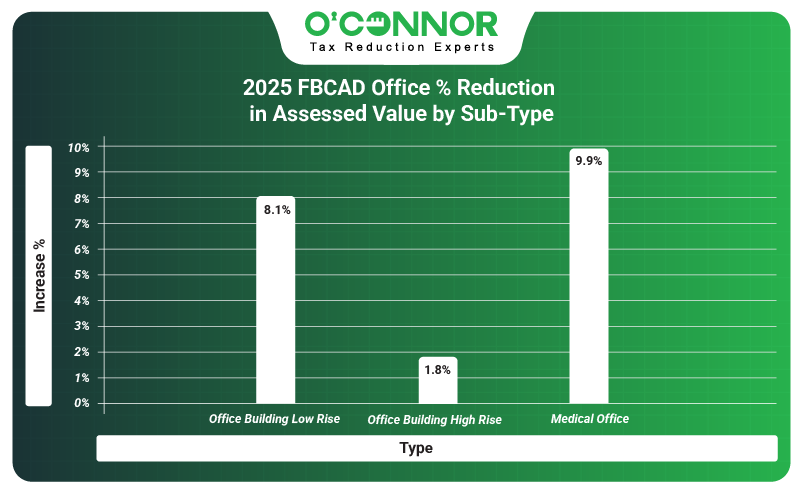
FBCAD uses three different subtypes to classify offices. The largest of these are low-rise buildings, which account for $1.81 billion of the total. Low-rise buildings managed to land a reduction of 8.1%, which was the largest of all. Medical offices, the No. 2 subtype, were reduced by 9.9%, while high-rises were slashed by 1.8% by using property tax appeals.
Retail Reduced by 8%
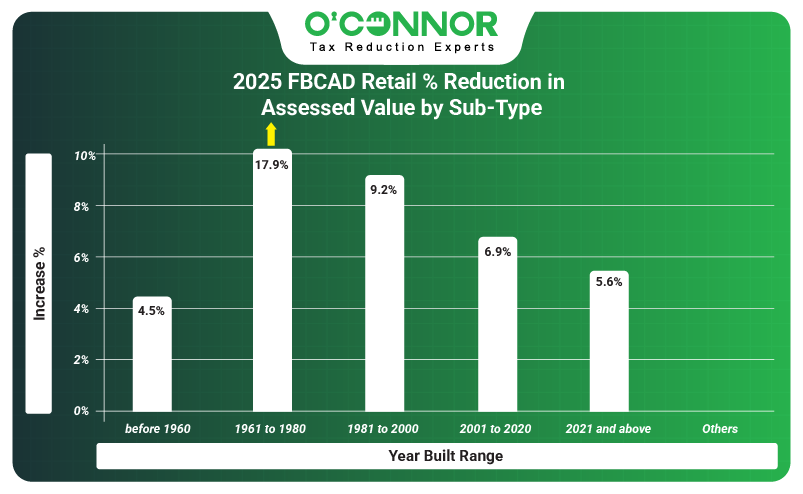
The pattern we have seen with every other property so far applies to retail spaces as well. After being whacked with a general increase of 25.6% to the total value, retail properties fought back the best they could with appeals, eventually winning an initial decrease of 8%. As is typical for Fort Bend, 51% of all value was constructed between 2001 and 2020, followed by 32% for those built between 1981 and 2000. These two large blocks then saw reductions of 6.9% and 9.2%, respectively. New construction was solidly in the No. 3 spot and was able to take home an eventual cut of 5.6%. After a giant value hike of 65.3%, retail stores built between 1961 and 1980 achieved savings of 17.9%.
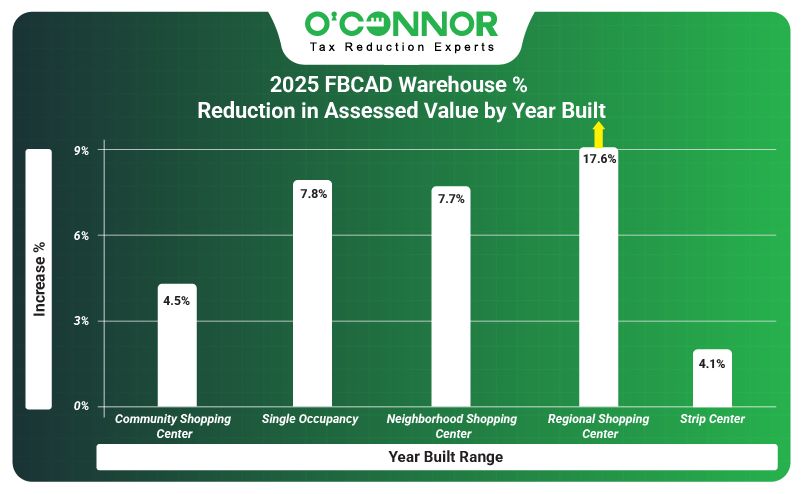
Retail spaces receive the most subtypes, which helps identify where the major sources of value and reductions are. Neighborhood shopping centers dominated with $2.54 billion in value, dwarfing all other types. These buildings did manage a savings of 7.7%, representing a major part of the grand total. Community shopping centers and regional shopping centers were No. 2 and No.3 and received reductions of 4.5% and 17.6% respectively.
Warehouses Break the Mold
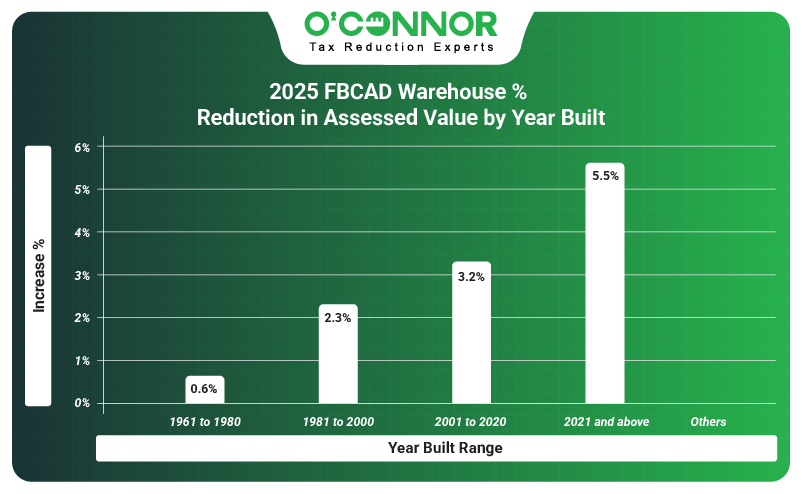
It took warehouses to finally break the streak of when commercial value was produced, if barely. While 65% of value was created between 2001 and 2020, 18% was built thanks to new construction. Those from 2001 to 2020 nabbed a reduction of 3.2%, while new construction landed a cut of 5.5%. New construction had previously been assessed by FBCAD as having grown by 27.7%, so this decrease was welcomed by owners. Warehouses built between 1981 and 2000 were third when it came to value generation, while also getting a reduction of 2.3%.
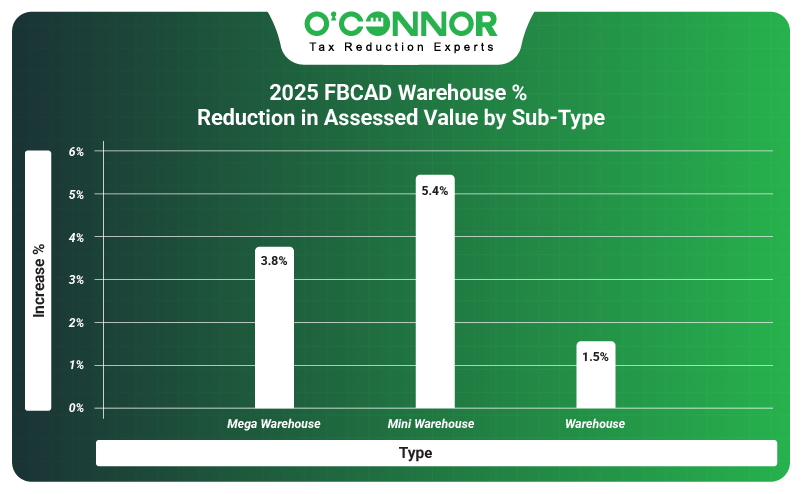
In a final unique twist, warehouses see their value broken down pretty evenly among three subtypes. Generic warehouses encompassed the most value, while also getting the lowest reduction at 1.5%. Mega warehouses were next in value, while securing a reduction of 3.8%. Mini warehouses were fittingly last in value but paradoxically also No. 1 in savings with a decrease of 5.4%.
Fort Bend is Waiting on the ARB
While Fort Bend County has seen some impressive reductions thanks to informal appeals, the savings discussed are just the tip of the iceberg. With informal appeals out of the way, the stage is set for formal appeals before the ARB and lawsuits against FBCAD. Much like other high-value counties like Travis, Denton, or Collin, the ARB is the preferred method for the taxpayers of Fort Bend County to achieve reductions. Appearing before a three-person body of experts, ARB hearings see the evidence of taxpayers pitted against that of FBCAD. In most of these meetings, the taxpayers have come out on top.
This should not overshadow what informal appeals were able to accomplish; however, as we have seen some impressive cuts. Whether you are in Fort Bend County or anywhere else in Texas, this should be a crystal-clear example of why you should always protest your property taxes. The people of Fort Bend never give an inch to FBCAD, even when it comes to the easiest of appeals. This helps keep FBCAD honest and allows Fort Bend to control property taxes to an extent.
We at O’Connor have been allies of the people of Fort Bend for decades. Based in Houston, our experts were some of the first to assist in countering sky-high property values. From informal appeals, to the ARB, to even lawsuits, we at O’Connor can provide you with an expert team that lives and breathes protecting clients. For over 50 years, we have stood up to appraisal districts, and we will continue to do so. Best of all, we will protest your taxes annually, making sure that you never miss a deadline or get taken advantage of.