Harris County is the largest and wealthiest county in Texas. Featuring Houston and its many suburbs, Harris County continues to grow its population and economy. Far more than just the oil and gas industry or the Rodeo, Houston’s economy continues to diversify, drawing more people every year. This has made homes and businesses more in demand than ever before, which has led to the Harris Central Appraisal District (HCAD) handing out record appraisals. In response, the people of Houston have deployed property tax protests at a record rate, with over 516,000 appeals filed in 2024 alone.
Harris County Residential Real Estate Adds 4.5% in Market Value
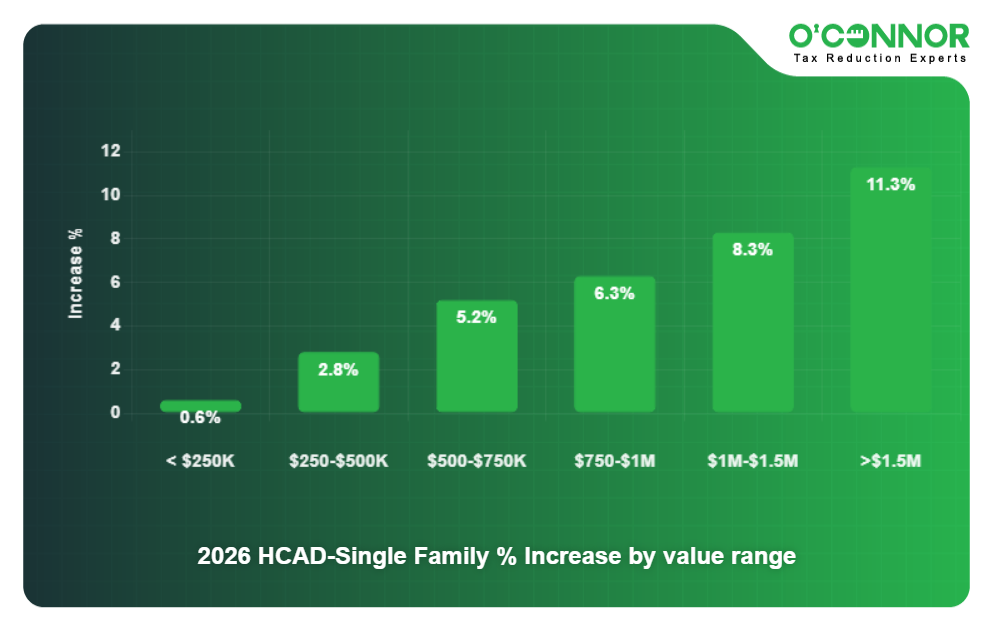
No matter the initial worth, every residential property category grew in value in 2026. While they grew by 2.8%, homes worth between $250,000 and $500,000 were the top source of value at $173.42 billion. This was followed by homes worth under $250,000, which increased 0.6% to $77.51 billion. Homes worth over $1.5 million grew an astounding 11.3%, taking third place with $64.58 million. Fourth place went to those appraised between $500,000 and $750,000, which added 5.2% to reach $55.15 billion.
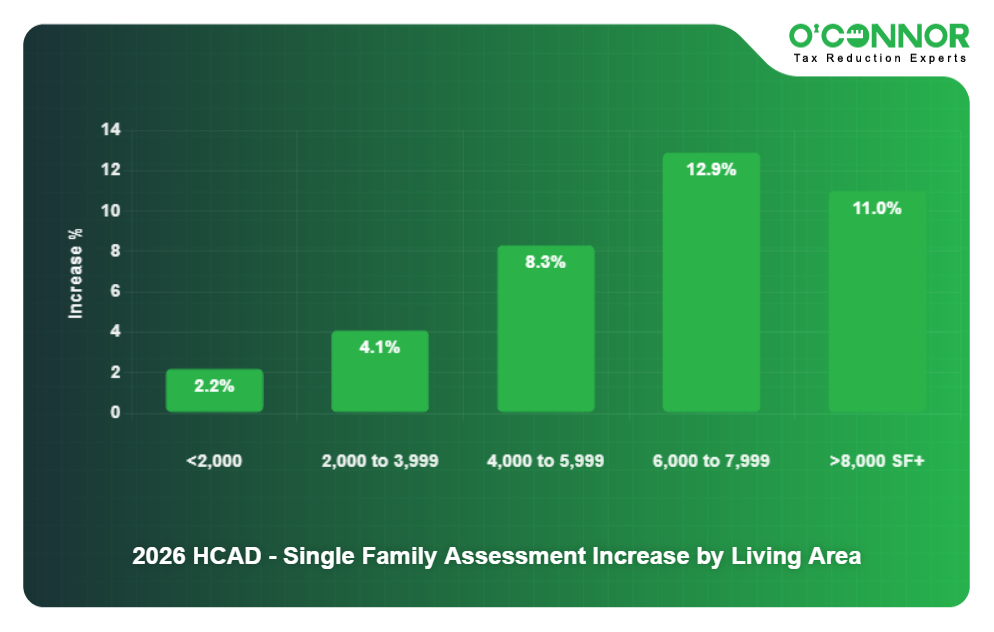
While large homes grew faster, the vast majority of residential value came from modest residences. Homes between 2,000 and 3,999 square feet increased 4.1% to take the top spot with $211.70 billion, followed by those under 2,000 square feet, which reached $130.42 billion. Jumping 8.3%, those between 4,000 and 5,999 square feet totaled $56.83 billion. The largest homes soared 11%, and reached $15.07 billion, while the second-largest hit $11.54 billion after increasing 12.9%.
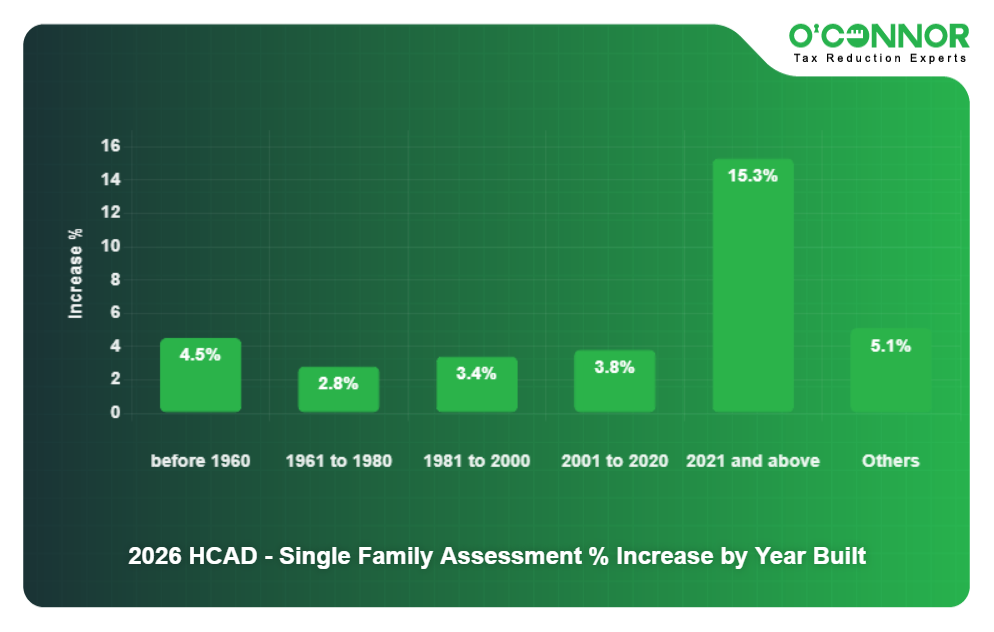
Consistently across Texas, the majority of home value has been built in the construction boom between 2001 and 2020. This is certainly true in Harris County, where 39% of all value was built in that timeframe, which added 3.8% more to its total in 2026. Homes built from 1981 to 2000 accounted for 22%, or $91.75 billion, which was reached by adding 3.4%. In third place were residences built from 1961 to 1980, which totaled $72.16 billion after increasing 2.8%. Even the oldest homes added 4.5% to achieve $61.33 billion. New construction jumped a staggering 15.3%, totaling $34.40 billion.
47% of Harris County Homes Were Overvalued
HCAD County Houses Valued above/below Market Value
In 2025, it was estimated that only 28% of homes in the Houston area were overvalued. That was easily dwarfed in 2026, which saw 47% of residences be appraised above their market value. HCAD has previously shown restraint, but it works slowly and cannot always keep up with market trends. This is why both overassessment and unequal appraisal are vital grounds for property tax protests.
Evidence of Overappraisal
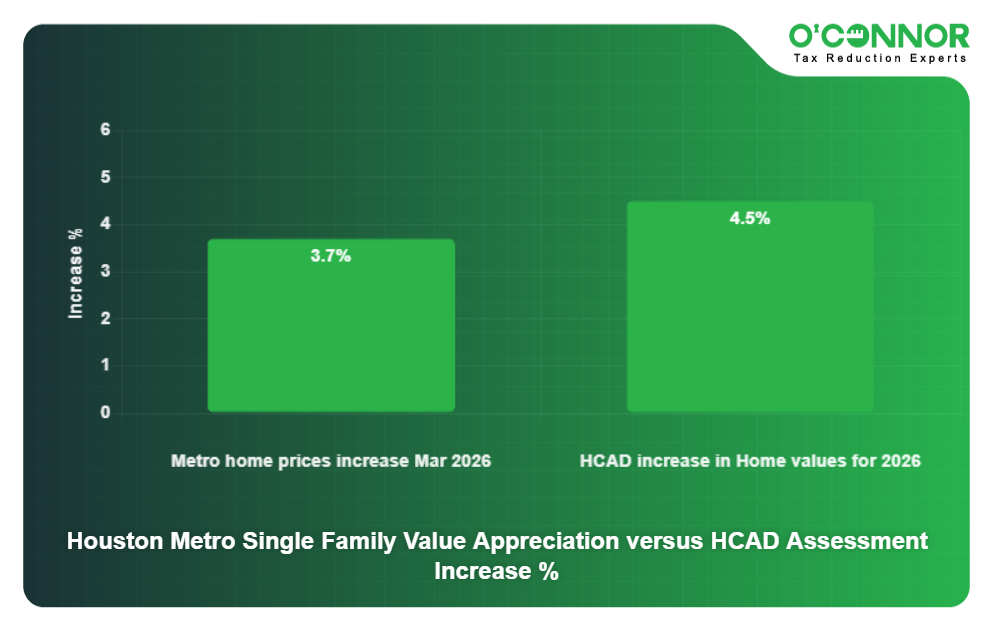
According to a study by local realtors, homes in the Houston metro area appreciated by around 3.7%, which was calculated by studying home prices from January 2025 to March 2026. In comparison, HCAD increased home values by 4.5%. While not a staggering difference, it does show the distance between actual market values and what HCAD measures. If a homeowner suspects that their appraisal is too high, then they would be justified in using a property tax appeal.
Commercial Value Adds 6.7%
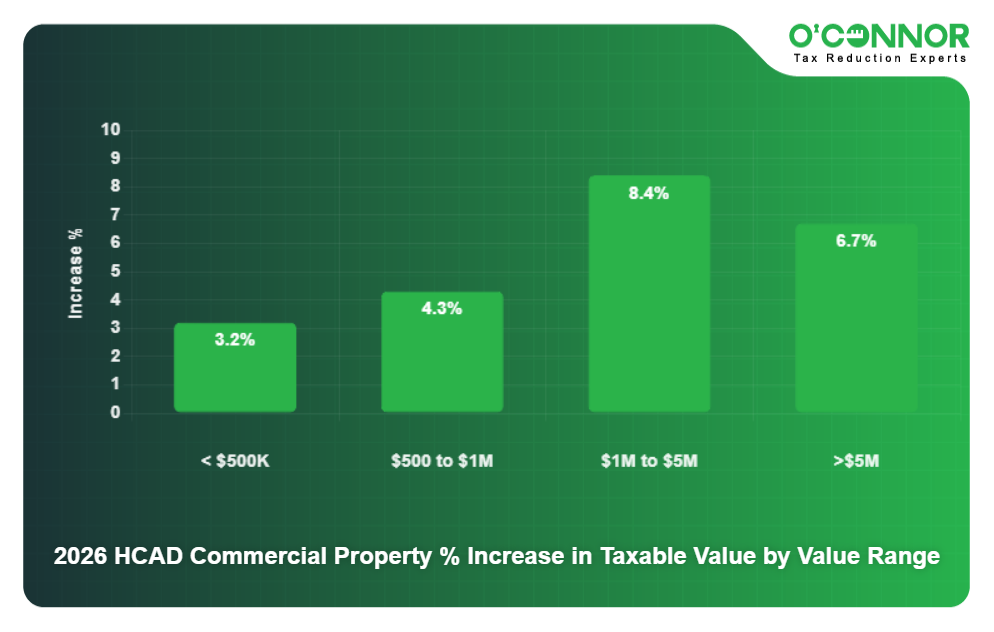
While Harris County residential real estate totaled $425.56 billion in 2026, commercial properties jumped 6.7% to $159.83 billion. This increase was mostly thanks to the largest businesses and properties in the county, which added 6.7% to reach $119.18 billion. In a very distant second place, businesses appraised between $1 million and $5 million added 8.4% to their market value, totaling $28.07 billion. Those worth between $500,000 and $1 million grew by 4.3%, reaching $7.04 billion. The smallest businesses totaled $5.55 billion after adding 3.2%.
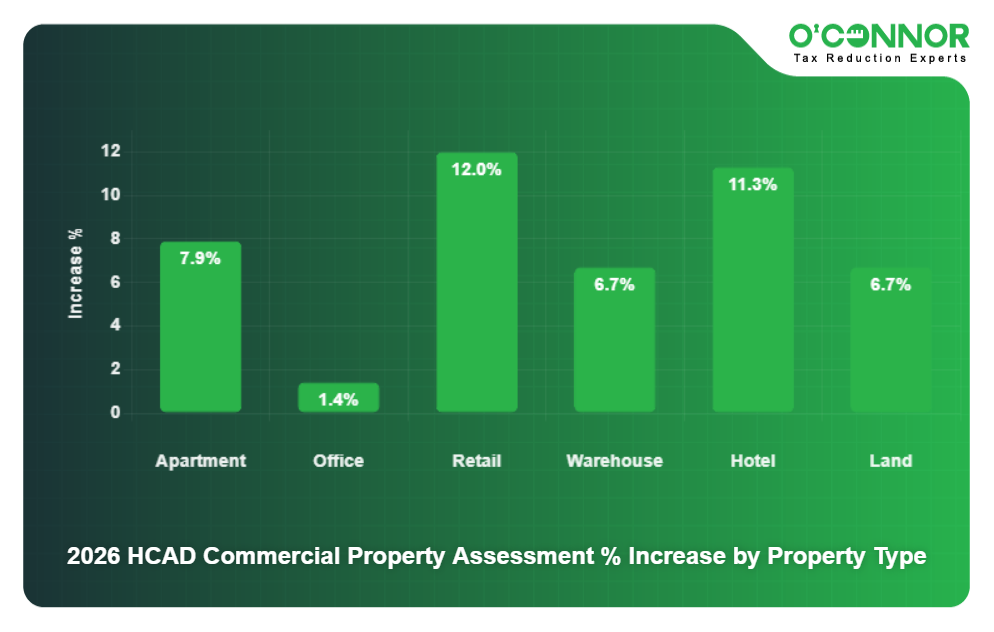
Like most urban counties, the largest source of commercial value was apartments, which totaled $65.64 billion after adding 7.9%. Despite being the slowest growers, offices still totaled $34.23 billion. Adding 6.7%, warehouses were in third place with $25.08 billion. Retail grew the fastest, adding 12% to achieve a final tally of $23.08 billion. Raw land managed to reach $11.70 billion thanks to a spike of 6.7%. While jumping 11.3%, hotels only totaled $112.27 million.
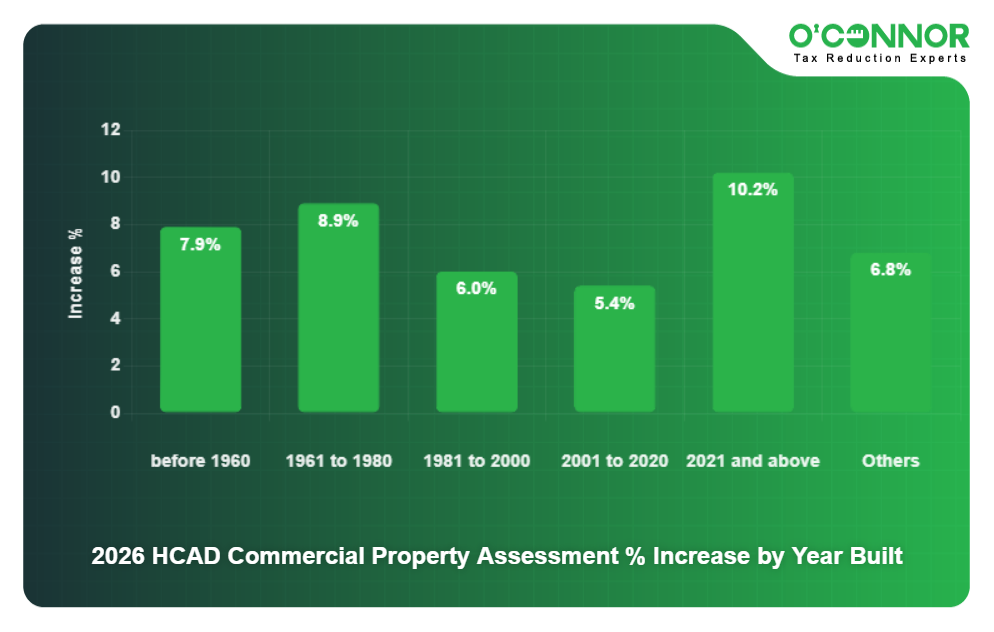
Businesses followed homes when it came to the age of construction for value. 38%, or $60.86 billion, was built from 2001 to 2020, which added to its lead by increasing by 5.4%. Those from 1981 to 2000 were in second place with $36.80 billion, while those from 1951 to 1980 contributed $34.82 billion. These increased by 6% and 8.9%, respectively. New construction jumped 10.2%, totaling $9.17 billion. Even the oldest businesses in the county managed to increase by 7.9%.
HCAD Appraises Businesses Higher Than the National Average
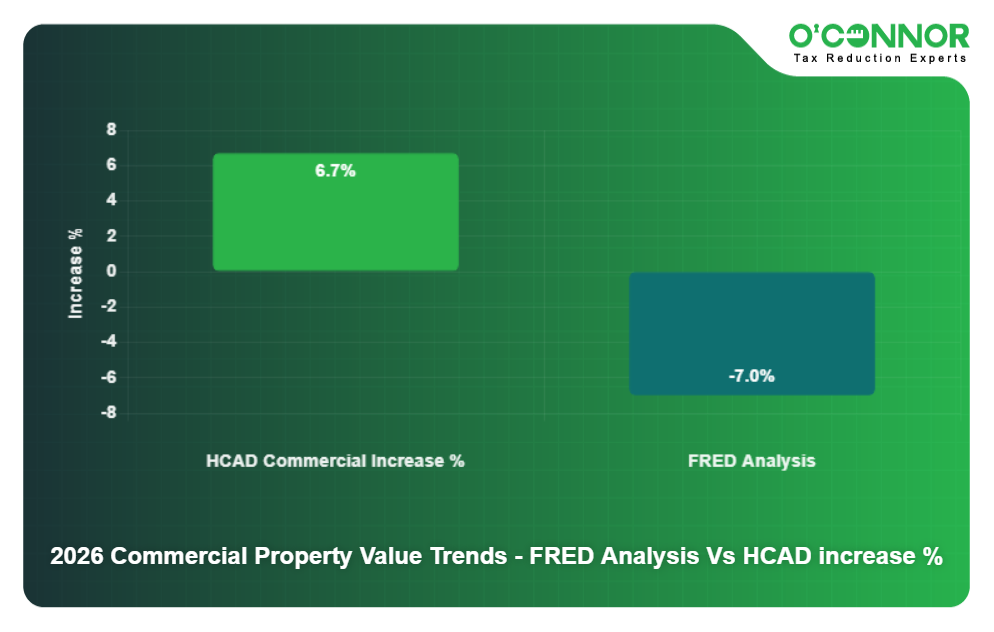
According to the Federal Reserve of St. Louis, over the past five years, the value of commercial properties has fallen 7%. This generally signals a persistent weakness in the commercial real estate market, generally because of sinking demand for retail spaces and offices. HCAD appraised commercial property in the county as having grown by 6.7%. While the Houston area is certainly thriving, that is still a big gap. Overassessment of businesses is commonplace, which is why it is recommended that every business protest annually.
Apartments Surge 7.9%
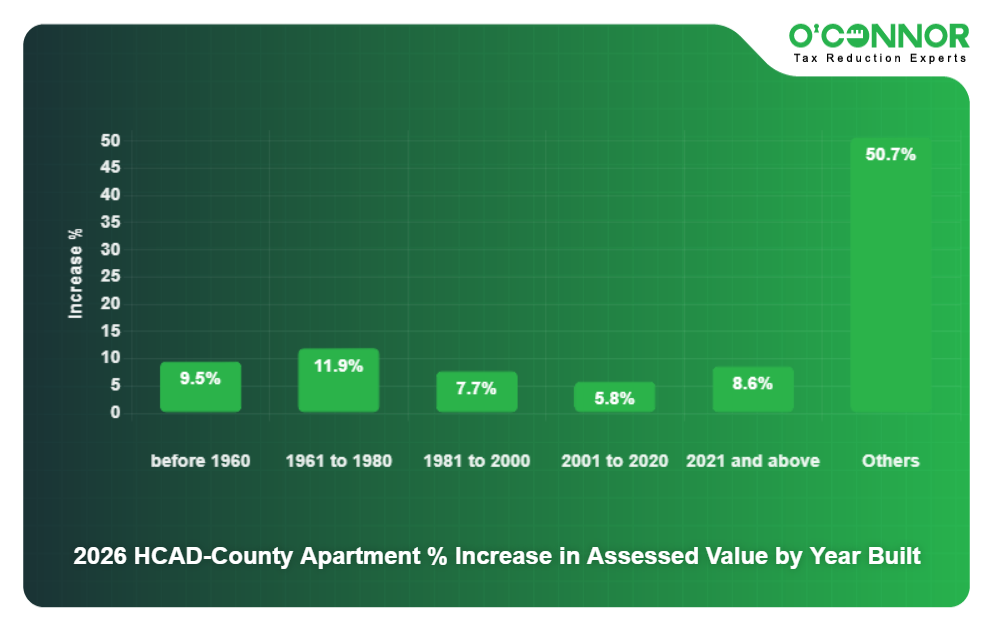
The top dogs of commercial value, apartments, followed the age of construction pattern set by other property types. 45% of all value was built between 2001 and 2020, which translated into $29.25 billion after an increase of 5.8%. Those built from 1961 to 1980 took second place with $14.74 billion in market value, while those from 1981 to 2000 accounted for $13.09 billion. These jumped in value by 11.9% and 7.7%, respectively. New construction added 8.6%, accounting for $6.49 billion. Raw land jumped a staggering 50.7%, though this only totaled $27.07 billion.
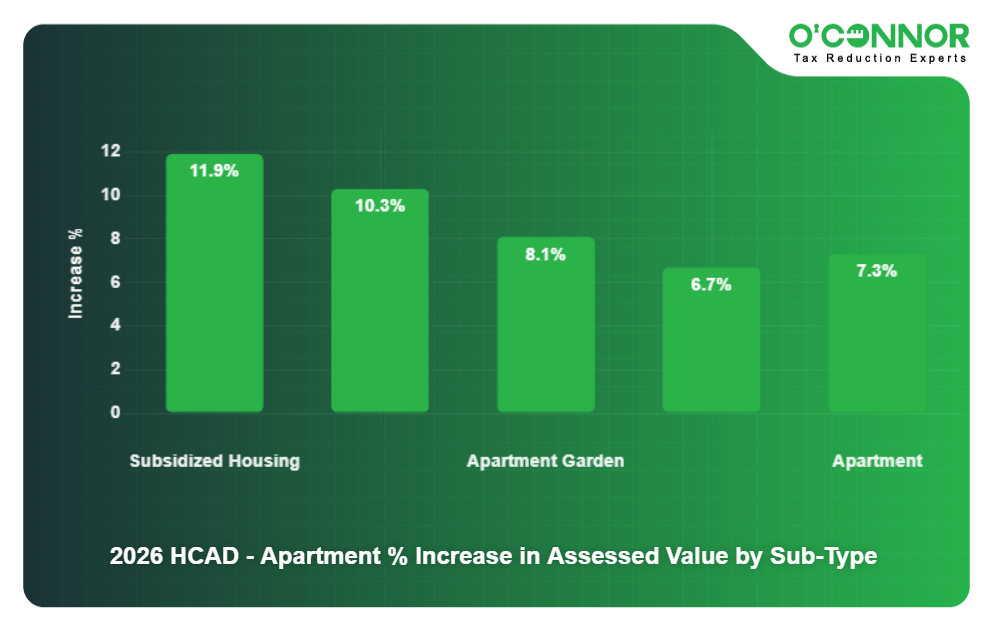
HCAD divided apartments into five categories. The largest was garden apartments, which totaled $37.68 billion after increasing by 8.1%. Mid-rise apartments reached $19.16 billion after surging 6.7%. High-rise apartments jumped 10.3% to total $5.93 billion. Subsidized apartments and generic apartments were only fractions of the value, but they added 11.9% and 7.3%, respectively.
Office Values Mostly Stagnate
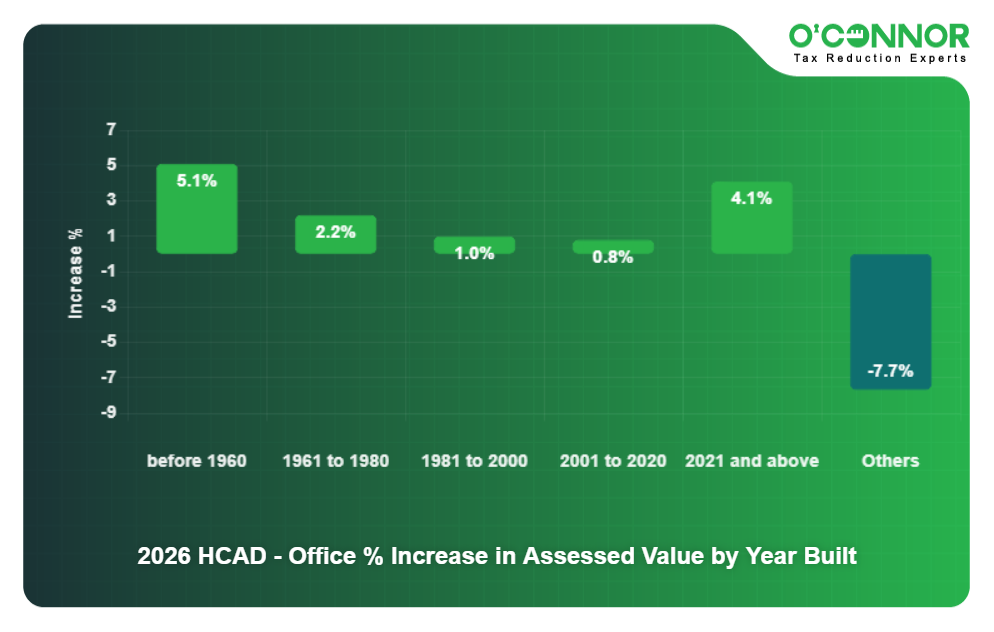
It is no secret that a good deal of Houston offices are currently vacant, though that has not caused values to fall. Understandably, new construction only accounted for $1.06 billion of the $34.23 billion total, adding 4.1% to its value. Those built from 2001 to 2020 accounted for 43%, or $14.71 billion, of the total, and edged up by 0.8%. Growing by 1%, those from 1981 to 2000 reached $9.79 billion, while those from 1961 to 1980 added 2.2%, totaling $7.68 billion.
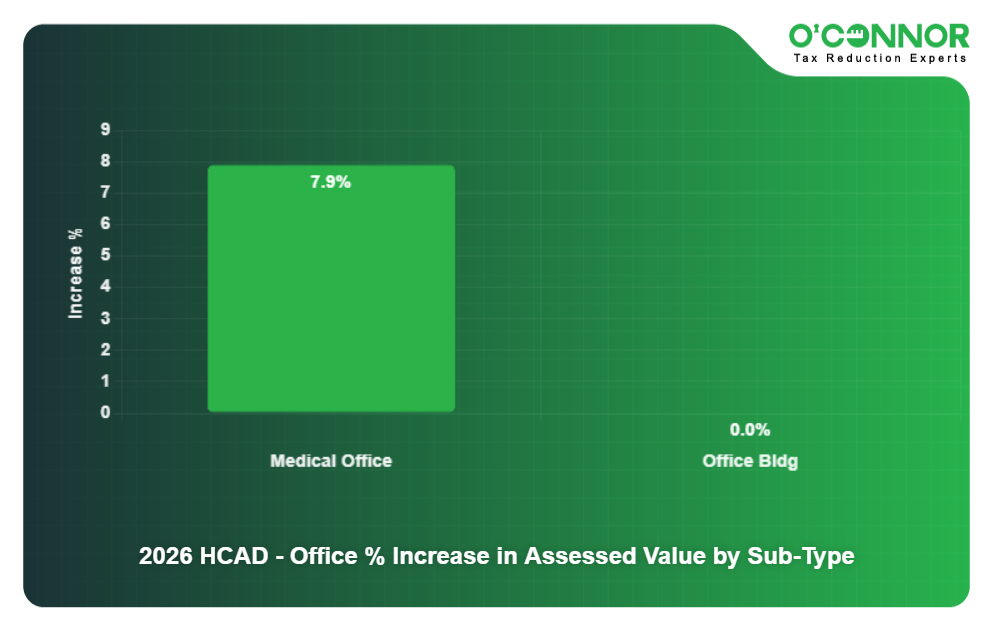
HCAD only broke offices down into two categories. Office buildings saw no growth, though they totaled $27.93 billion. Medical offices surged 7.9%, accounting for $6.30 billion. This implies that virtually all of the office value growth was tied to medical offices.
Retail Spikes 12%
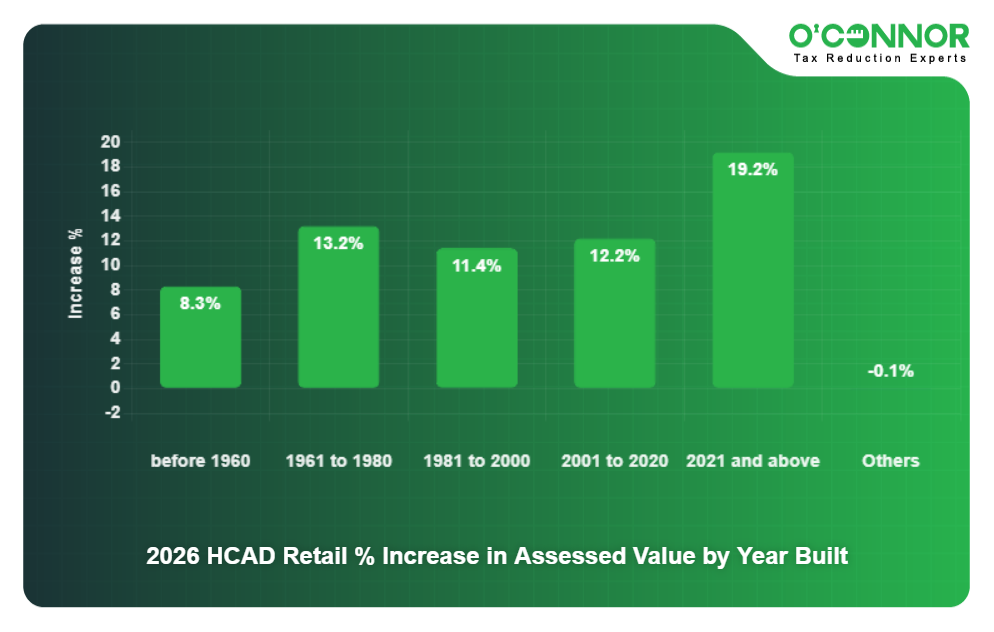
While offices have not gotten out of their pandemic slump, retail spaces have been making a comeback for the past few years, including adding 12% in 2026, reaching $23.08 billion. When it comes to the age of construction, retail followed the pattern set by all other real estate. The majority of value was built from 2001 to 2020, which totaled $8.16 billion after a significant increase of 12.2%. Adding 11.4%, stores from 1981 to 2000 totaled $6.65 billion, while those from 1961 to 1980 reached $5.94 billion after surging 13.2%. Even stores built before 1960 managed to add 8.3%, which meant a final tally of $1.90 billion. New construction added 19.2%, for a final figure of $421.91 million.
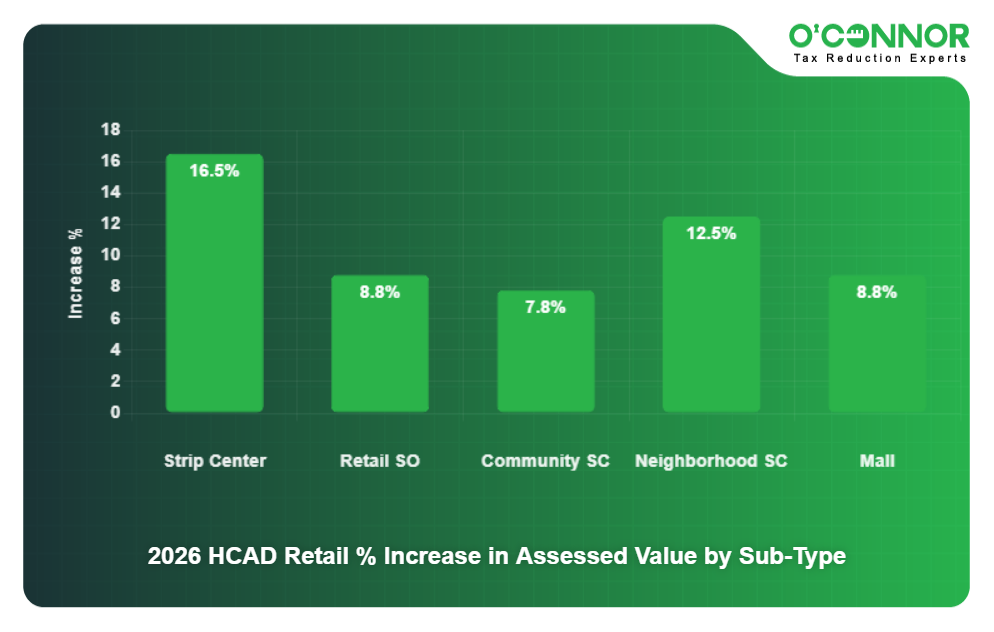
Seeing the highest total and the largest growth, Houston-favorite strip malls proved their worth, with a final sum of $7.95 billion. Neighborhood shopping centers were second in growth and value with 12.5% and $5.22 billion, respectively. Community shopping centers totaled $4.54 billion, while single-occupancy stores accounted for $3.30 billion. Malls rounded things out with 8.8% in growth and a final sum of $2.07 billion.
Warehouses See an Increase of 6.7%
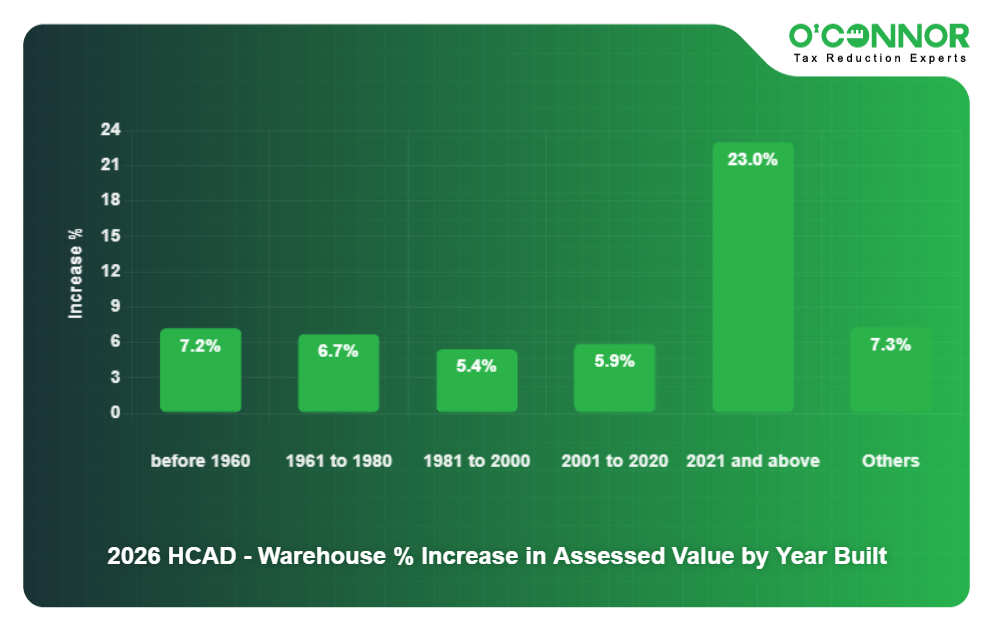
Warehouses have been surging across Texas in 2026, and those of Harris County followed suit. Jumping 6.7%, the kings of storage totaled $25.08 billion. Like all other properties, this was mostly thanks to those built between 2001 and 2020, which totaled $8.69 billion after increasing by 5.9%. Those from 1981 to 2000 totaled $7.24 billion, while those from 1961 to 1980 reached $6.40 billion. These jumped by 5.4% and 6.7%, respectively. Spiking 23%, new construction accounted for $1.19 billion.
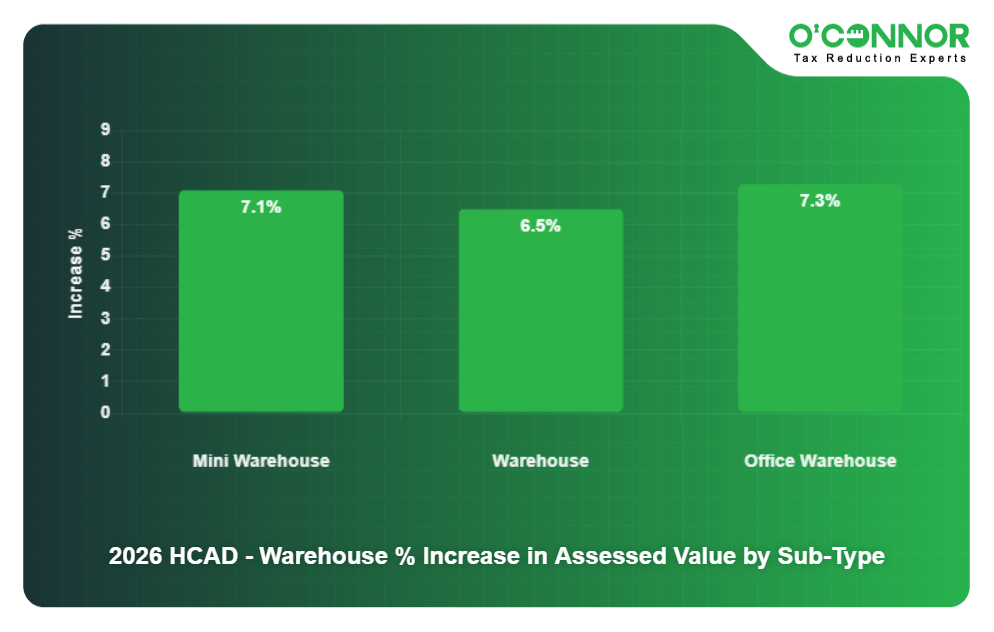
HCAD divided warehouses into three categories. Generic warehouses were the largest at $15.42 billion, which was achieved after adding 6.5%. Office warehouses jumped 7.3% to $4.90 billion, while mini warehouses added 7.1% to $4.75 billion.
O’Connor is a Houston Favorite
For over 50 years, the people of Harris County have counted on O’Connor to lower their taxes through property tax protests, exemptions, cost segregation, and more. Based in Houston, we at O’Connor know HCAD like no other firm, whether national or local firms. As one of the largest property tax consulting firmss in the nation, we can call upon national resources to aid our Houston clients, while still relying on our local expertise. Thanks to our central location, we can often send out a concierge member to your home or business, where they can help with exemptions, look over your appraisal, and identify issues that can help a potential appeal.
Every client that signs up with us gets a client success consultant who acts as a personal guide through the whole process. Rather than relying on a rotating cast of customer service representatives, you are given a consistent person to communicate with when it comes to your case. Your client success consultant will act as your advocate when it comes to the expert who is taking care of your appeal and hearings, ensuring you are always current with what is going on. This premium personal touch is one of the primary things that has built our word-of-mouth in our hometown.
We use data-driven resources to gather information and evidence for your appeal, tapping our databases to find the best comparable sales or appraisals, which can swing the case in your favor. We also have deep knowledge of both HCAD and the appraisal review board (ARB) in Harris County, which helps us get better resolutions faster. We will also give free assistance when it comes to your homestead exemption, as this is vital for any homeowner’s financial well-being. There is no cost to join O’Connor, and you will only pay from your savings if we can lower your property taxes.