Centered on Killeen, Temple, and Fort Hood, Bell County is one of Texas’s hidden gems. Because it lies outside the Texas Triangle, the county often goes unnoticed, but it is one of the state’s primary economic areas and has been growing for the past decade. Like much of Texas, Bell County has seen property values double over the past decade, leading to higher taxes. In response, the people of the county have used more property tax appeals than ever before and saved tens of millions of dollars in 2025 alone, thanks to these protests.
Homes Add 2.3% in Market Value
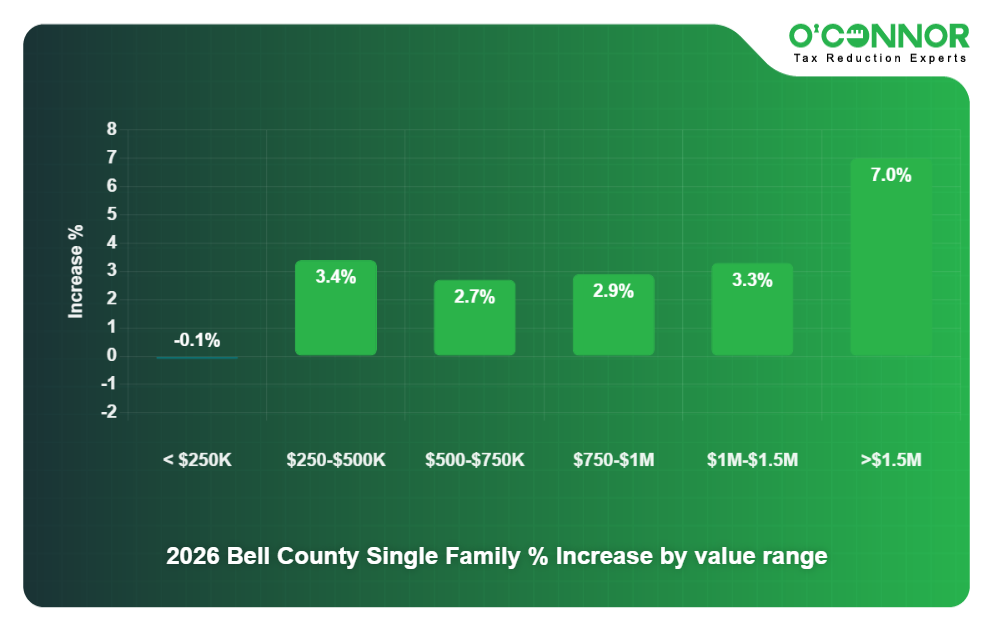
In 2025, the market value of homes in Bell County climbed by 3.6%. Market value is what the Tax Appraisal District of Bell County (Bell CAD) believes a property would sell for on January 1 of the tax year. In 2026, the market value for homes climbed 2.3%, for a new total of $35.87 billion. The two largest sources of value by far were homes under $250,000, with $10.50 billion, and those worth between $250,000 and $500,000, which totaled $16.78 billion. The value of these two categories fell by 0.1% and grew 3.4%, respectively. Those worth between $500,000 and $750,000 added 0.27% to reach $4.32 billion. The largest increase came from the largest homes, with those worth over $1.5 million spiking 7% to total $1.30 billion.
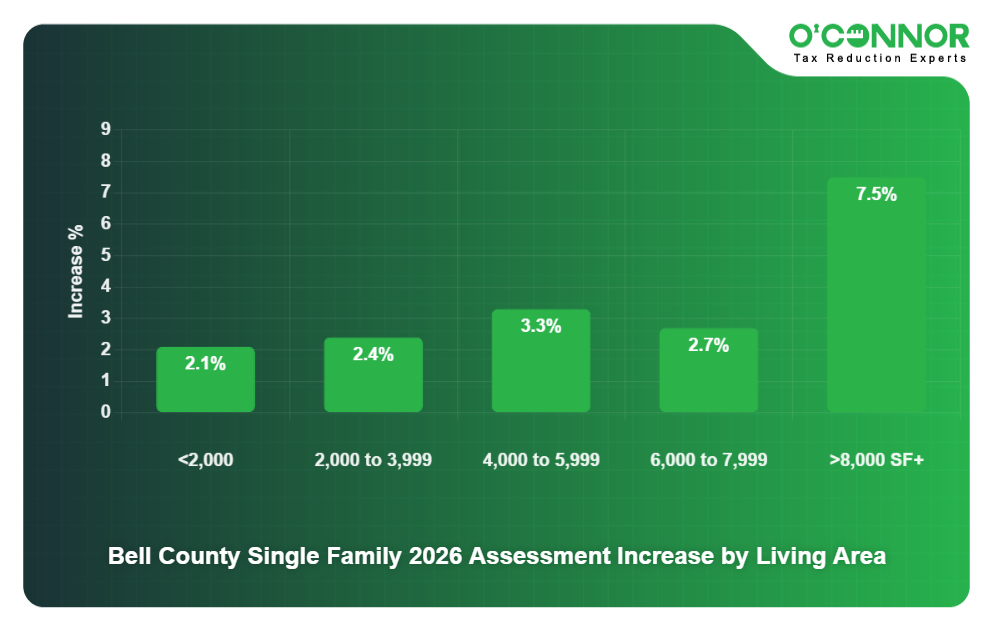
As the breakdown by prices would indicate, most market value in Bell County comes from modest homes, showcasing the area’s long history of working families. Increasing 2.1%, homes measuring under 2,000 square feet were responsible for $16.79 billion of the total. Homes between 2,000 and 3,999 square feet totaled $17.19 billion after a jump of 2.3%. Homes measuring between 4,000 and 5,999 square feet added 3.3% to total $1.25 billion. Luxury homes jumped 7.5% in value, which translated into a final total of $376.48 million.
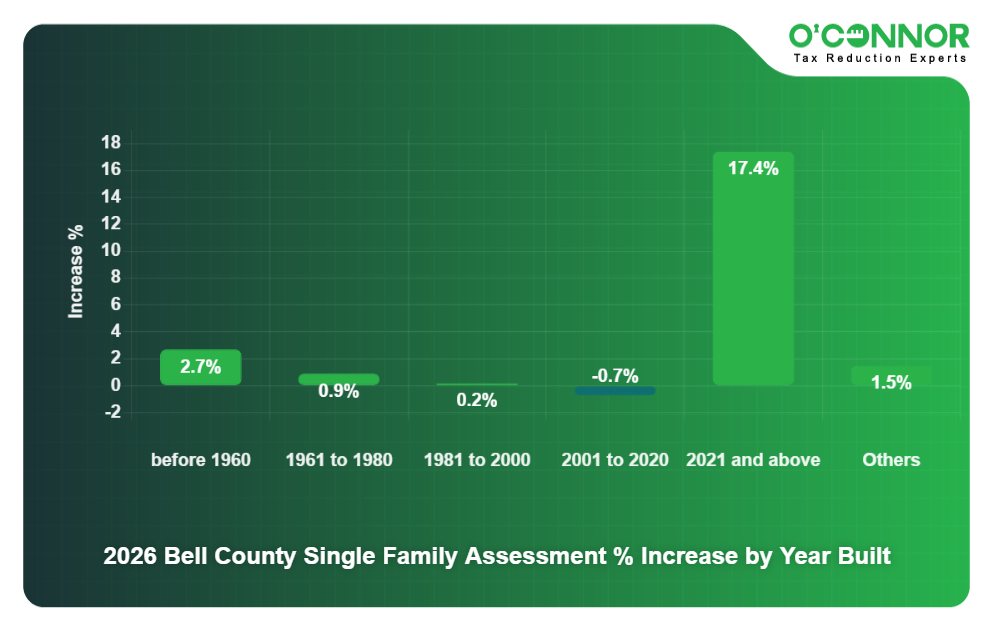
When it comes to the age of construction, most Texas counties saw a building boom between 2001 and 2020, with Bell County being no different. $16.40 billion, roughly 46% of residential market value, was built in this timeframe. This large chunk declined by 0.7%, but was the only timeframe to lose value. Homes from 1981 to 2000 were in second place with $7.30 billion, following an uptick of 0.2%. New construction surged by 17.4%, for a total of $5.54 billion, showing that the boom is ongoing. Totaling $2.35 billion, homes built before 1960 added 2.7% to their market value.
Half of Bell County Homes are Overvalued
Houses Valued above/below Market Value based on Jan 2025 – Mar 2026 Sales
Market value is determined by the study of home sales. In 2026, a study by local realtors showed that roughly 49% of homes in the county were being overvalued by Bell CAD. In 2025, it was estimated that only 38% of homes had been overvalued, an improvement from 2024. The values assessed by appraisal districts tend to lag behind the market, which often opens these numbers up to property tax appeals.
Commercial Properties Spike by 6.1%
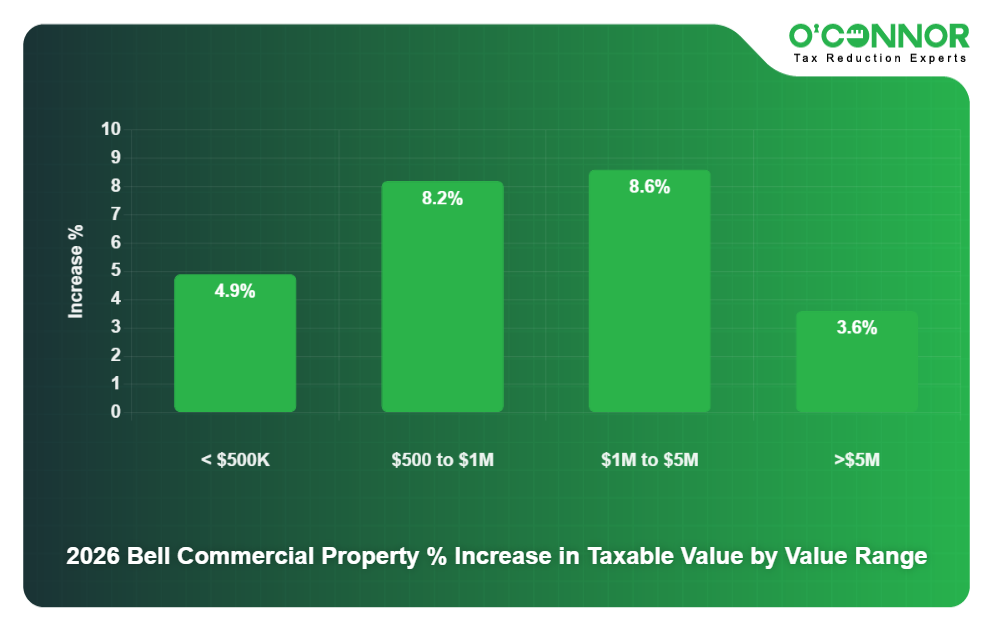
In 2025, businesses added to their market value by a combined 9.9%. 2026 built on this trend by seeing values soar by 6.1%, bringing the overall total to $7.60 billion. Typically, most Texas counties see the majority of value tied up in the largest businesses. However, in Bell, these top businesses barely edged out the next tier of properties. Climbing 3.6%, the largest businesses totaled $2.54 billion. Those worth between $1 million and $5 million jumped 8.6% to $2.49 billion. Those worth between $500,000 and $1 million spiked 8.2% to $1.08 billion.
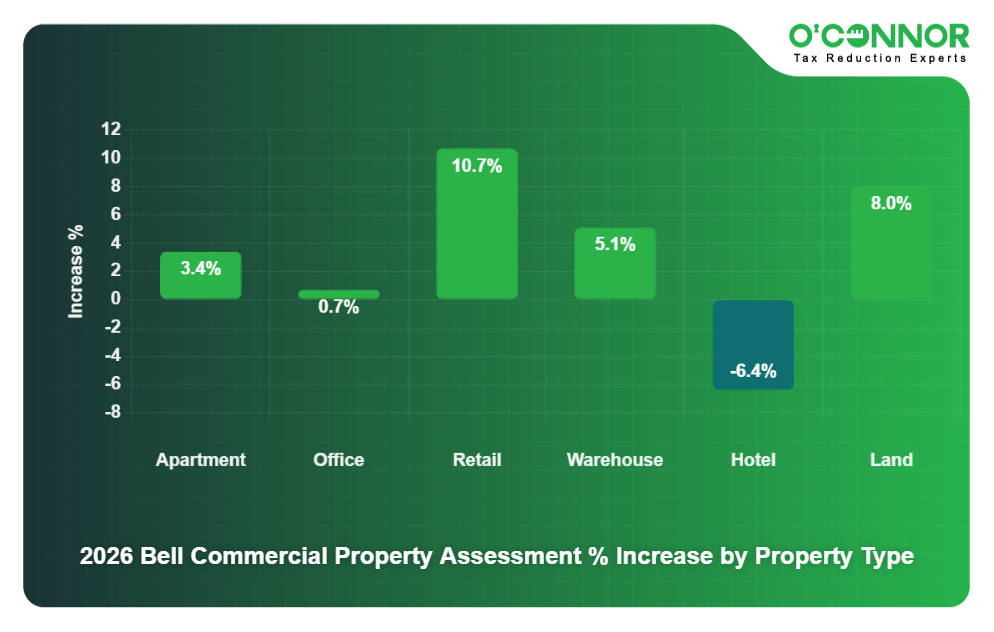
When it comes to market value, the most important type of commercial property in Bell County is raw land, which increased 8% to $3.36 billion. For developed properties, apartments were No. 1 with $1.76 billion, following an uptick of 3.4%. Retail came in second with $1.03 billion, following a large jump of 10.7%. Warehouses added 5.1% to total $876.04 million, while offices reached $365.47 million. Hotels were the only type to lose value, sinking by 6.4%.
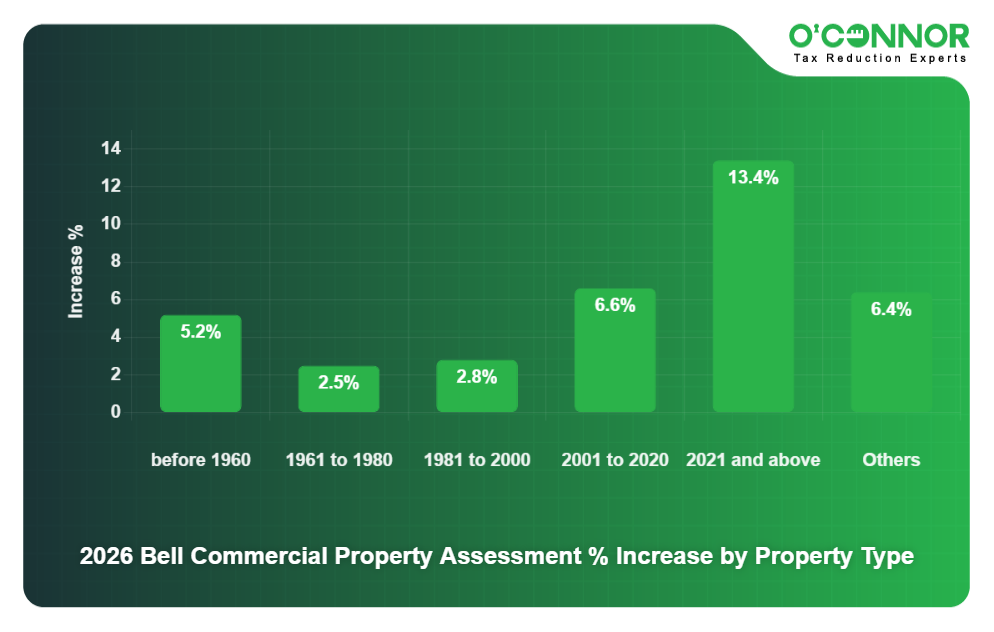
Outside of raw land, commercial property has a larger recency bias than homes. $1.89 billion in market value was built between 2001 and 2020, which added 6.6% in 2026. New construction jumped 13.4% to $671.85 million. Those from 1981 to 2000 accounted for $1.09 billion following an uptick of 2.8%. Even the oldest commercial properties saw increases, with 2.5% for those from 1961 to 1980 and 5.2% for the oldest businesses, though these combined for a total of under $899 million.
Bell Business Value Climbs While Nationwide Average Falls
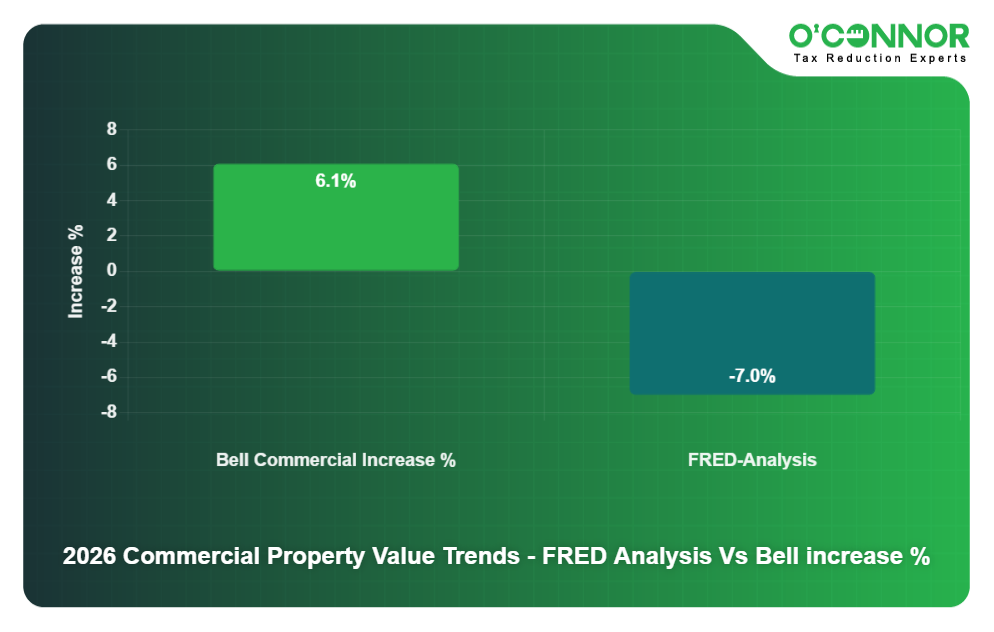
According to the Federal Reserve of St. Louis (FRED), the average commercial property value across the nation has fallen by 7%. This is mostly thanks to empty office spaces and changes in how Americans do business. On the other hand, Bell CAD believes that the value of commercial real estate has increased by 6.1%. The Texas economy is currently booming, so some of the growth that Bell CAD assesses is certainly true. However, these federal numbers do plant a seed of doubt and demonstrate why most businesses appeal their taxes every year.
The Market Value of Apartments Climbs by 3.4%
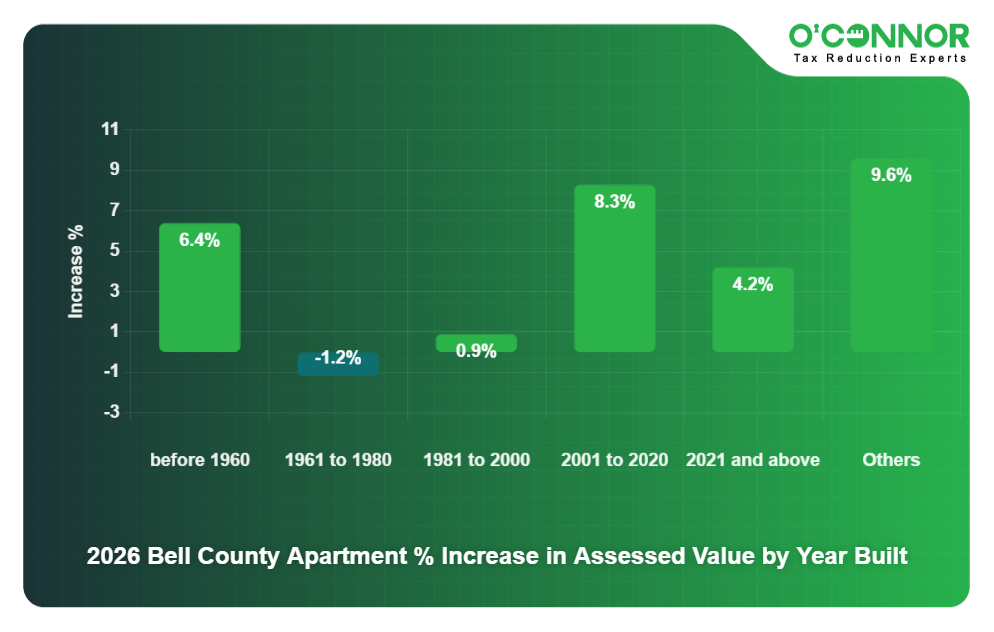
Apartments are typically the No. 1 commercial property in urban environments, and this is certainly true for Bell County. Increasing by 3.4%, apartments were responsible for a total of $1.76 billion in market value. 34% of this value was built from 2001 to 2020, following an increase of 8.3%. New construction added only 4.2%, but still accounted for $295.70 million. Apartments from 1981 to 2000 saw an uptick of 0.9% to total $505.07 million, while those from 1961 to 1980 fell 1.2% to $351.72 million.
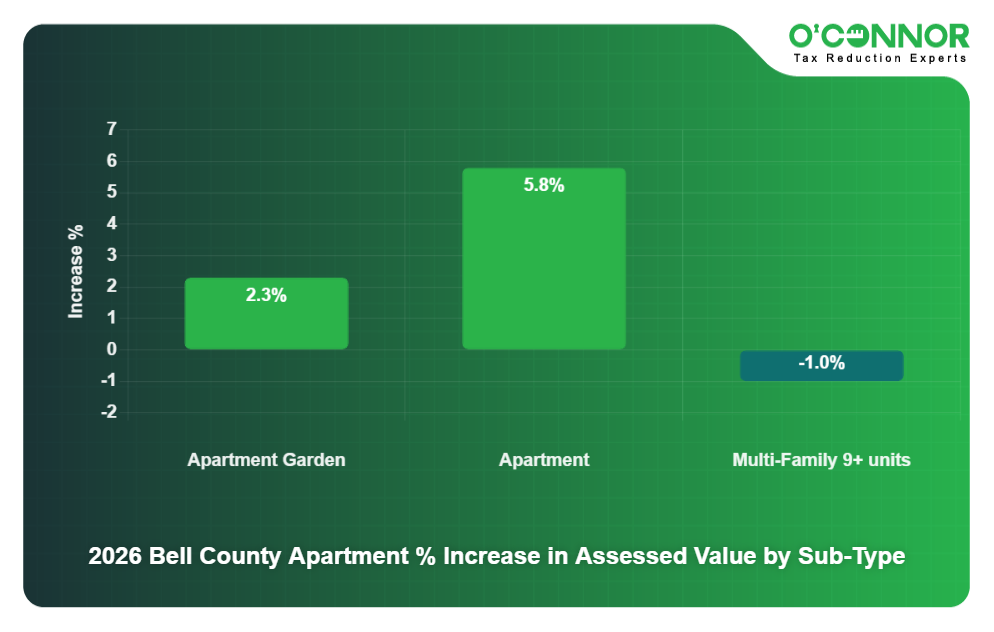
Bell CAD divided apartments into three categories. The largest was generic apartments, which jumped 5.8% to $1.167 billion. This was followed by multi-family units, which dropped 1% in value to total $595.83 million. Finally, garden apartments added 2.3% to total $8.42 million.
Offices Increase by 0.7%
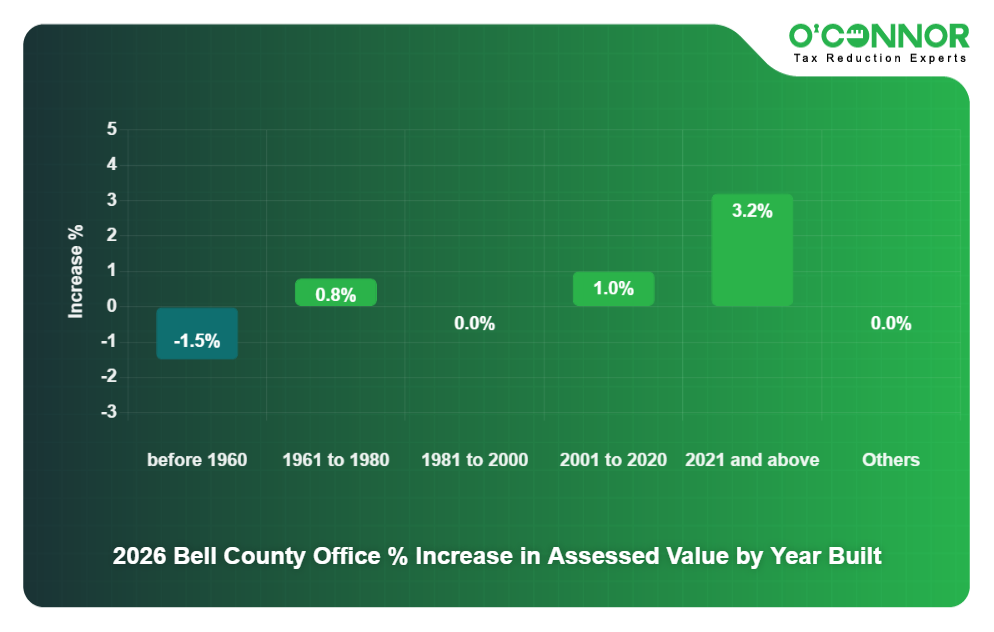
Across the nation, offices are generally facing some of the stiffest economic conditions. In 2026, the offices in Bell County increased in value by 0.7%, which translated into a total of $365.47 million. 55% of this was built in the boom period of 2001 to 2020, totaling $202.82 million. Reflecting modern conditions, new construction only accounted for $6.21 million following an increase of 3.2%. Those from 1981 to 2000 saw no growth, but still totaled $101.61 million. The two oldest timeframes accounted for less than $57 million combined.
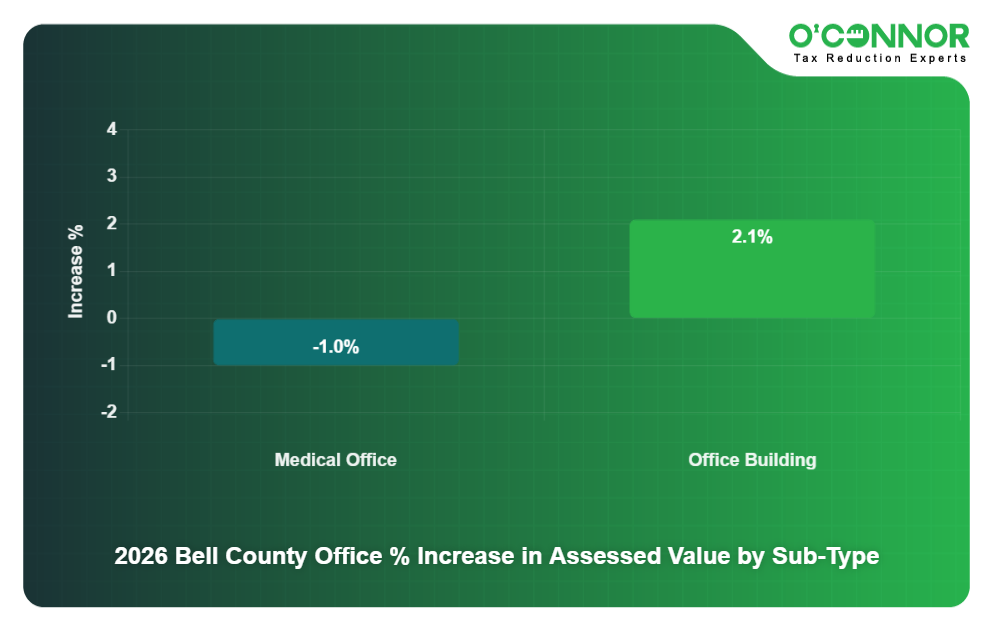
There were only two office subtypes. Office buildings added 2.1% to total $203.01 million. Medical offices saw a decrease of 1% and had a final sum of $162.45 million.
Retail Spikes 10.7%
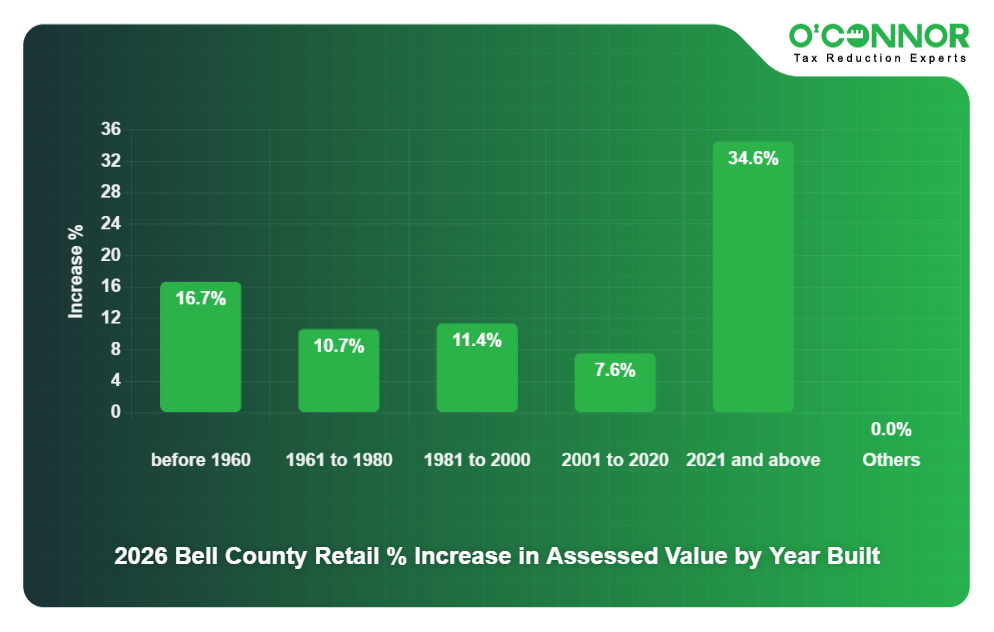
No commercial property saw its market value increase faster than retail spaces. While these have seen uneven growth since the pandemic, they have done well in Killeen and the surrounding area. 53% of the $1.03 billion value was constructed between 2001 and 2020, following a surge of 7.6%. New construction saw a large spike of 34.6%, totaling $78.78 million. Older stores saw impressive growth as well, including a jump of 11.4% for those built from 1981 to 2000. Those from 1961 to 1980 added 10.7% to reach a final sum of $180.38 million.
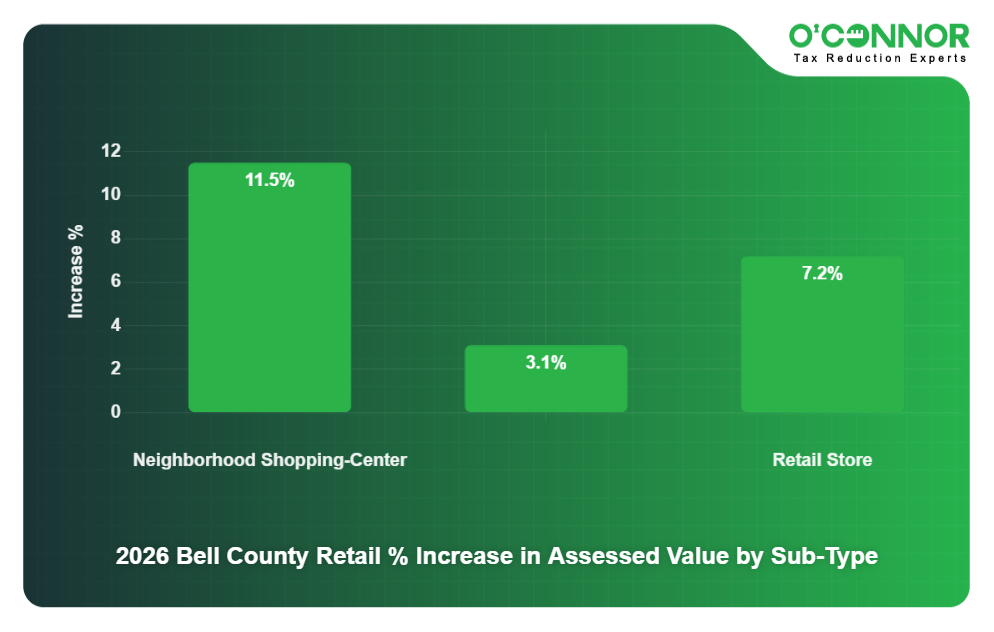
There were three subtypes of retail property according to Bell CAD. Generic retail stores were the largest source of value at $837.68 million, following a large spike of 11.5%. Retail stores added 7.2% to achieve a final total of $187.89 million. Single-tenant big box stores were last with $6.22 million.
Warehouses Add 5.1%
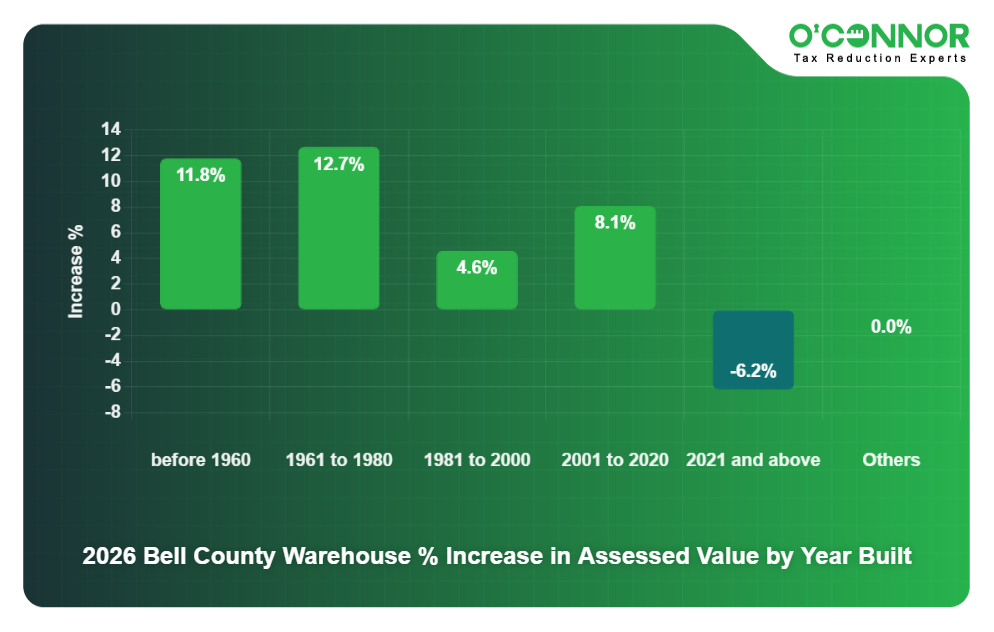
Warehouses surged 24.5% in market value in 2025, mostly to contemporary and recent construction. In 2026, warehouses of all stripes combined for an increase of 5.1%, totaling $876.04 million. To keep with the overall theme of the county, 48% of this value was thanks to the building boom of 2001 to 2020, which climbed an additional 8.1% in 2026. New construction accounted for 16% of the total, but saw an odd reduction of 6.2%. Those from 1981 to 2000 jumped 4.6% to $207.13 million. The largest growth was seen from those built between 1961 and 1980, which added 12.7% to total $97.73 million. The oldest warehouses spiked 11.9%, though they only combined for $5.33 million.
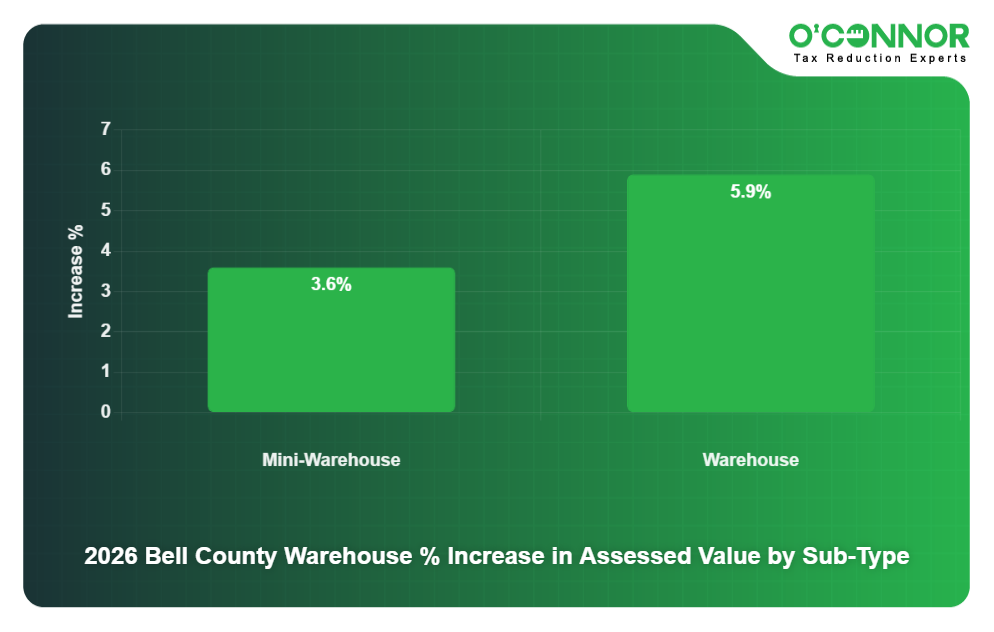
There were only two subtypes of warehouse. Generic warehouses had a total of $589.82 million following an increase of 5.9%. Mini warehouses climbed 3.6% to $286.22 million.
O’Connor Can Help Even After Deadlines
For the majority of Bell County, the deadline to file a property tax appeal was May 15. There is still a chance for late notices of appraisal that arrive late, however, as you have 30 days after your appraisal was mailed to appeal, even if the deadline has passed. If you have filed a protest already, you can still get expert representation and assistance from us at O’Connor. We are happy to lend our over 50 years of experience to your informal appeal, your formal hearing with the appraisal review board (ARB), or even in litigation against Bell CAD itself.
In 2025, those who chose O’Connor to handle their appeal saw much better results than others were able to achieve. We were able to help our residential clients save a combined 2.9%, while we helped businesses cut their market value by 4.8%. These were both double the average savings. We did this by offering better evidence and expert representation at hearings, which secured better results.
When you sign up with us, you will be given a client success consultant. They will act as your primary point of contact, walk you through the whole process, and answer any questions you have. They will act as an advocate for you with hearing experts and other members of your team, ensuring that you are always updated. There is no cost to join, and you will only be charged a portion of your winnings if we can lower your taxes.