While Harris County may be the largest in Texas, and Travis might be the trendiest, it is the DFW area that is seeing some of the most explosive growth. Made up of Dallas, Tarrant, Collin, and Denton counties, among others, millions of people and countless major companies call the area home. Denton County has established itself as one of the most in-demand suburbs in the country and has consequently seen property values triple since 2014. While much of that growth is thanks to organic improvement, aggressive appraisal by the Denton Central Appraisal District (DCAD) is certainly part of the equation as well. To counteract this, the people of Denton have been using property tax protests in record numbers.
Denton Homes Grow by 2.7%
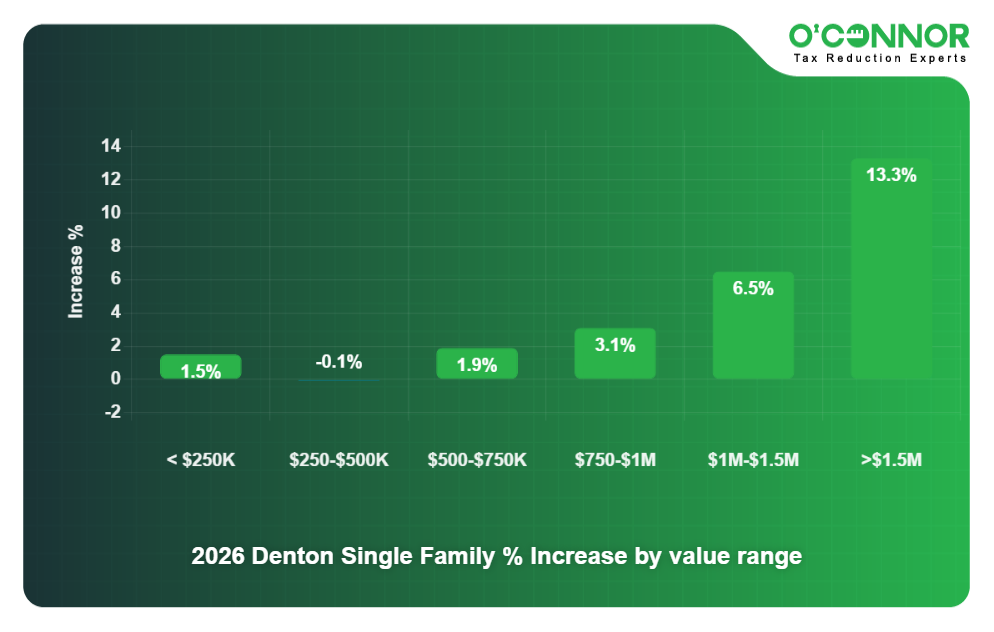
In 2025, Denton County residential real estate increased by 5.6%. 2026 built upon that with an additional 2.7%, which translated into a final total of $158.05 billion. Despite the increase, the largest source of value, homes worth between $250,000 and $500,000, dropped 0.1% to total $58.17 billion. This was the only negative number, however, and the second place category of those worth $500,000 to $750,000 jumped 1.9% to $43.02 billion. It was more expensive homes that forced the overall total to rise, including 3.1% for homes worth between $750,000 and $1 million, and 6.5% for those worth between $1 million and $1.5 million. Soaring 13.3%, homes worth over $1.5 million totaled $13.42 billion. Homes worth less than $250,000 added 1.5%, but totaled only $4 billion.
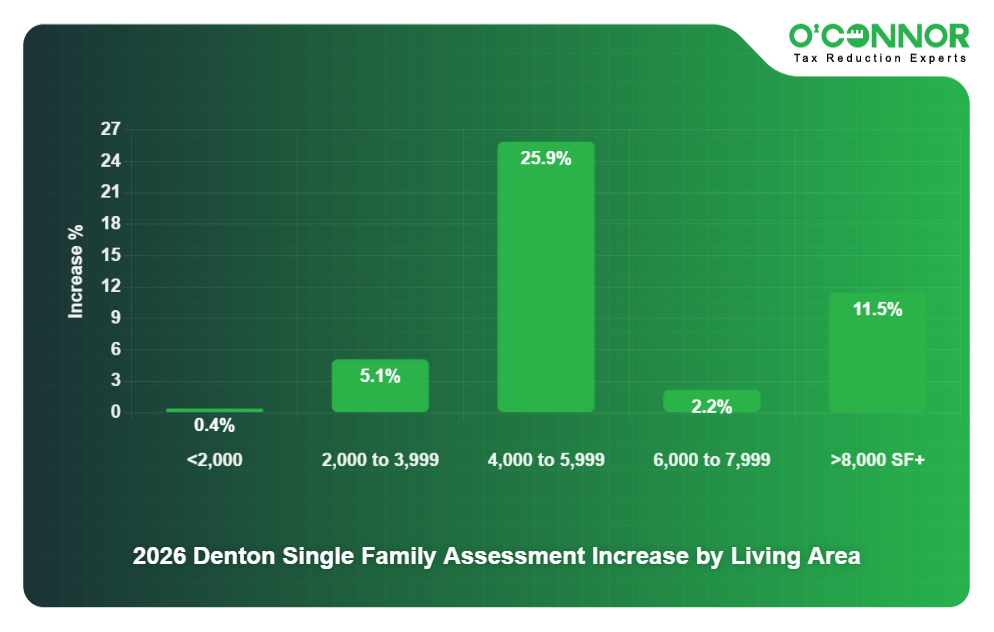
The largest source of residential real estate value in the county came from homes measuring between 6,000 and 7,999 square feet. These homes reached $94.77 billion following an increase of 2.2%. Jumping 5.1%, homes between 2,000 and 3,999 square feet took third place with $24.86 billion. The smallest residences edged up 0.4% for a final sum of $33.57 billion. Though they added an astonishing 25.9% in value, homes between 4,000 and 5,999 square feet only accounted for $1.71 billion. Surging 11.5%, true mansions accounted for $3.14 billion.
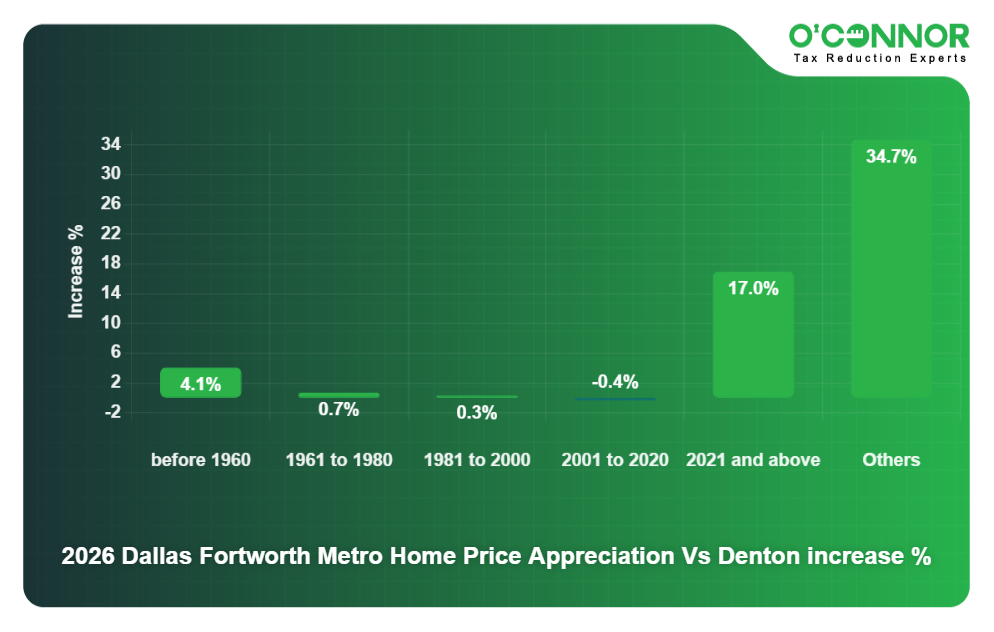
Due to Denton becoming a trendy county only in the past decade or so, it should come as no surprise that it leans heavily on recent construction as a source of value. 50% of all value was built between 2001 and 2020, a total of $79.47 billion. This timeframe did see a slight retreat at 0.4%. New construction boomed by 17%, totaling $28.14 billion. Those built from 1981 to 2000 saw a small increase of 0.3%, reaching $38.88 billion. Raw land surged by 34.7%, but only accounted for $201.45 million. The remaining timeframes combined for only 7% of the overall value.
44% of Denton Homes Could be Overvalued
Houses Valued above/below Market Value based on Jan 2025 – Mar 2026 Sales
In 2025, it was estimated that DCAD had overvalued around 36% of homes. Despite an aggressive appeal campaign in 2025, it seems that these numbers only increased. In 2026, it was estimated that 44% of homes in Denton County were overvalued. While this is moving in the wrong direction, it does show that even more protests will be necessary in the county in 2026 and into the near future.
Denton County Business Value Surges Over 25%
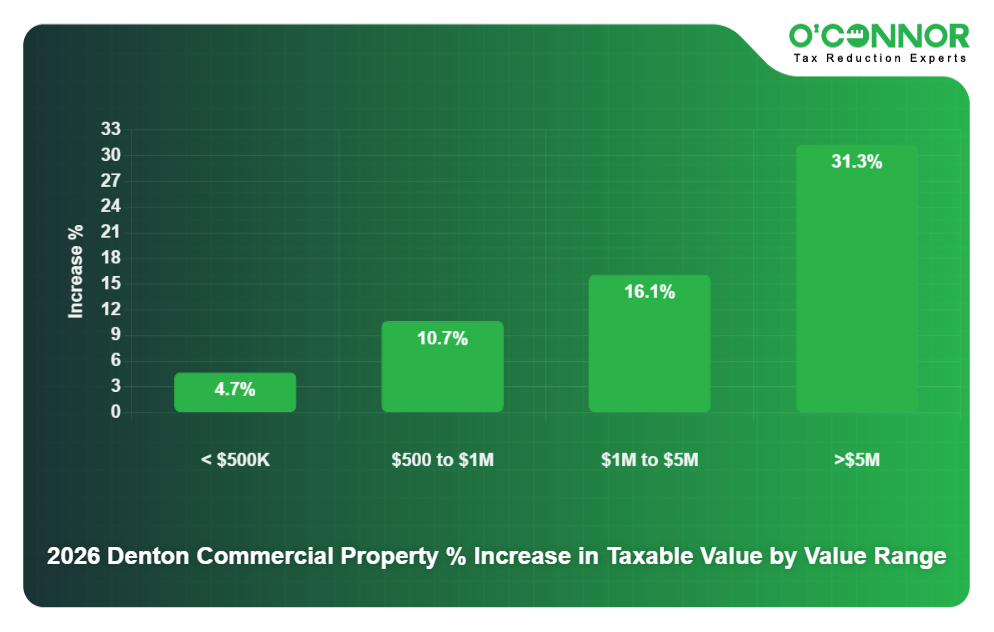
Commercial real estate stole the show in 2025, adding a staggering 26.4%. 2026 was close behind, adding 25.4%, resulting in a final tally of $44.30 billion. The main reason for the increase was a staggering increase of 31.3% for business real estate worth over $5 million. This resulted in a final total of $30.33 billion, up from $23.56 billion. Surging by 16.1%, those worth between $1 million and $5 million accounted for $9.46 billion. Small businesses jumped 4.7% to $1.74 billion, while those worth between $500,000 and $1 million grew 10.7% to $2.16 billion.
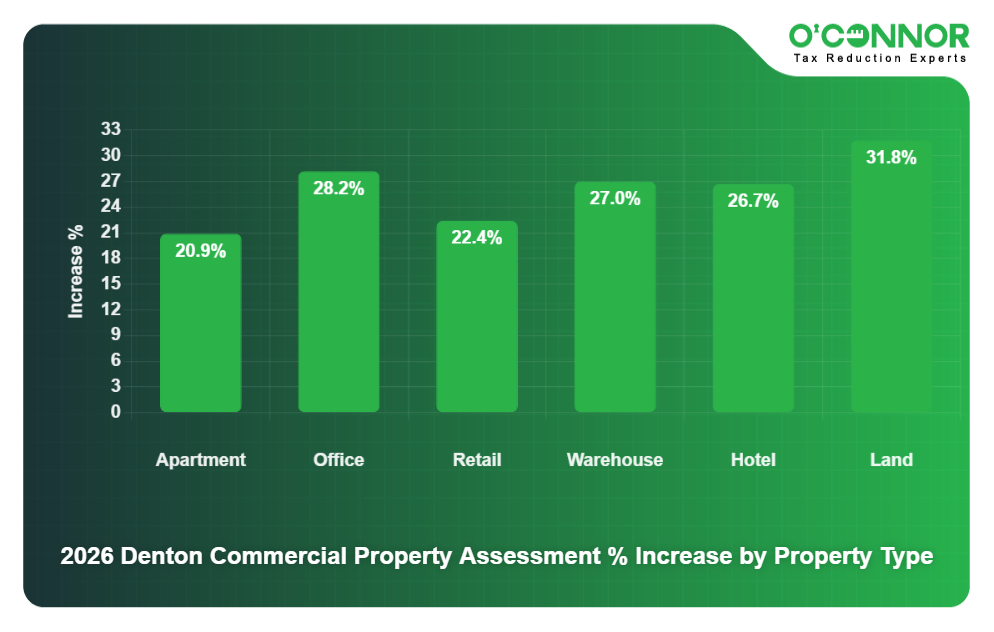
No matter the type, all business property surged over 20% in 2026. Apartments added 20.9%, which translated into a final sum of $19.99 billion. These were followed by raw land, which soared 31.8% to $15.28 billion. Retail added 22.4% to achieve $3.83 billion, while offices grew 28.2% to $2.88 billion. Warehouses surged 27% to $1.70 billion. Though the smallest category, even hotels added 26.7%.
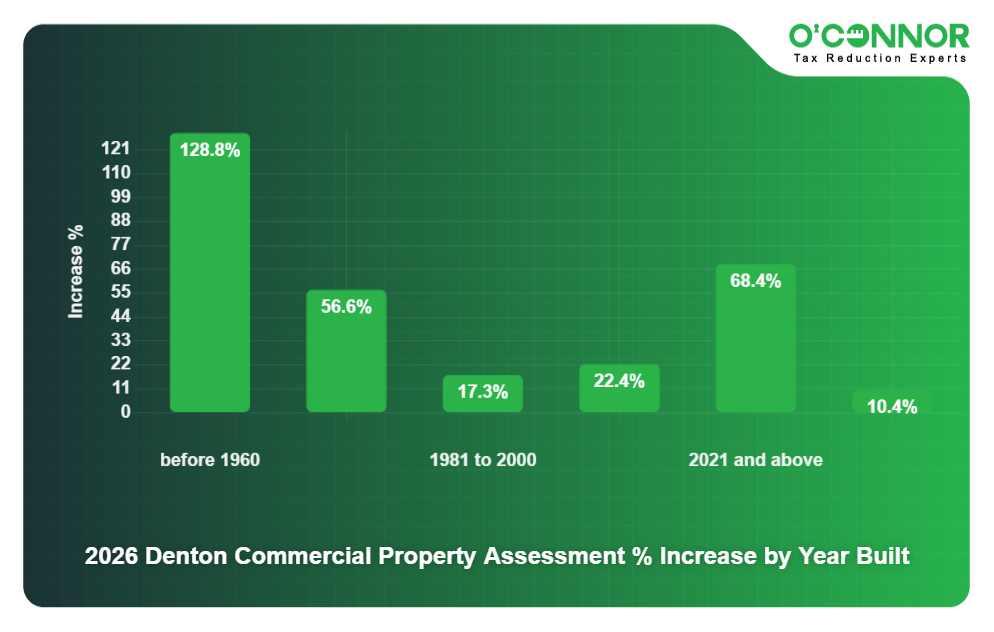
Businesses had an even larger recency bias than homes did. Shooting up 22.4%, buildings from 2001 to 2020 accounted for $14.50 billion. Jumping 17.3%, those from 1981 to 2000 reached $8.18 billion. New construction soared 68.4% to $7.78 billion. Raw land added 10.4%, which resulted in a final total of $11.79 billion. The remaining timeframes saw large increases, but only accounted for about 5% of the overall value.
Commercial Property Across the Nation Falls 7%
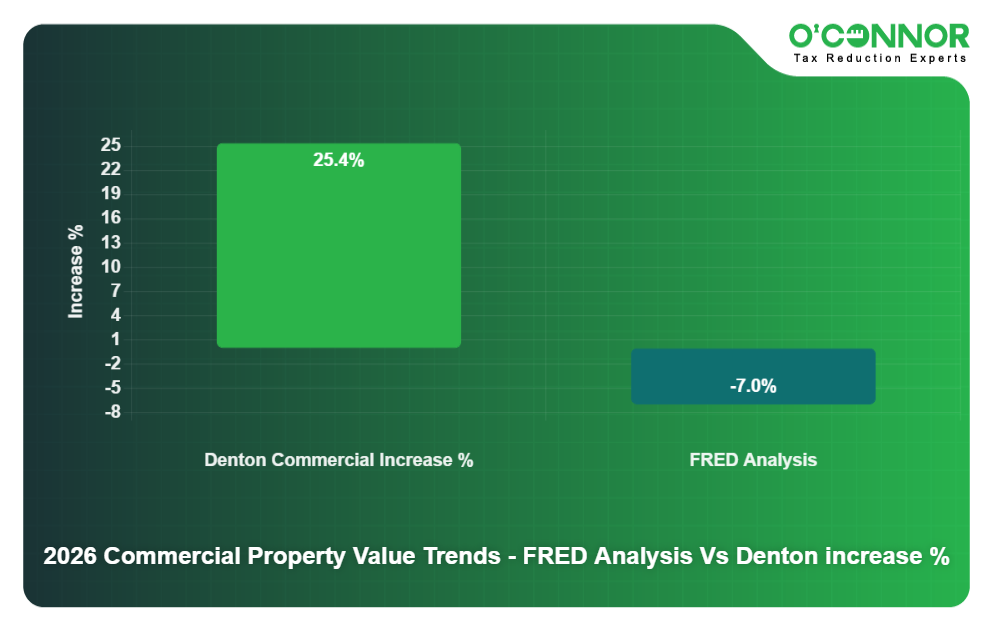
While DCAD appraised commercial property across the county as having surged 25.4%, the Federal Reserve of St. Louis (FRED) released a study showing that business value across the nation had actually fallen 7%. While Texas has fared far better than most of the nation after the pandemic, the FRED numbers should still give business owners pause. DCAD had assessed values as having risen over 25% for two consecutive years, which could be overly aggressive. This leaves plenty of ambiguity for a possible property tax protest.
Apartments Add Over $3 Billion in Taxable Value
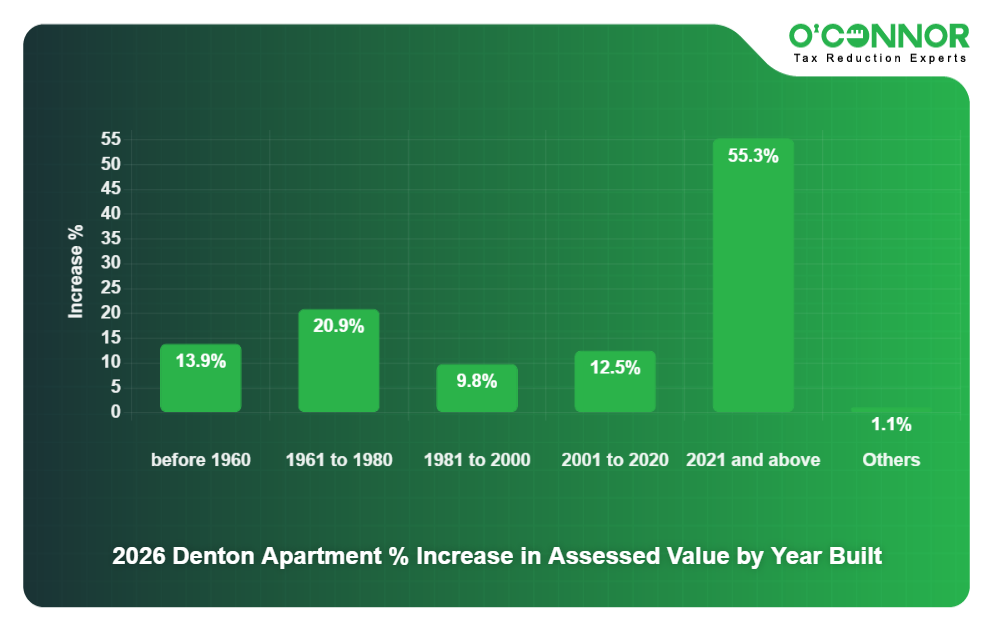
Like most urban and suburban counties, the largest category of business value was apartments at $19.99 billion. This was possible thanks to a surge of 20.9% in just one year. Adding 12.5%, the largest source of value was buildings constructed from 2001 to 2020, with $8.44 billion. New construction thundered up the charts with an increase of 55.3%, and reached a total of $5.36 billion. Those constructed from 1981 to 2000 added 9.8% to total $5.48 billion. The remaining timeframes accounted for only 3% of the overall total, but still saw impressive increases.
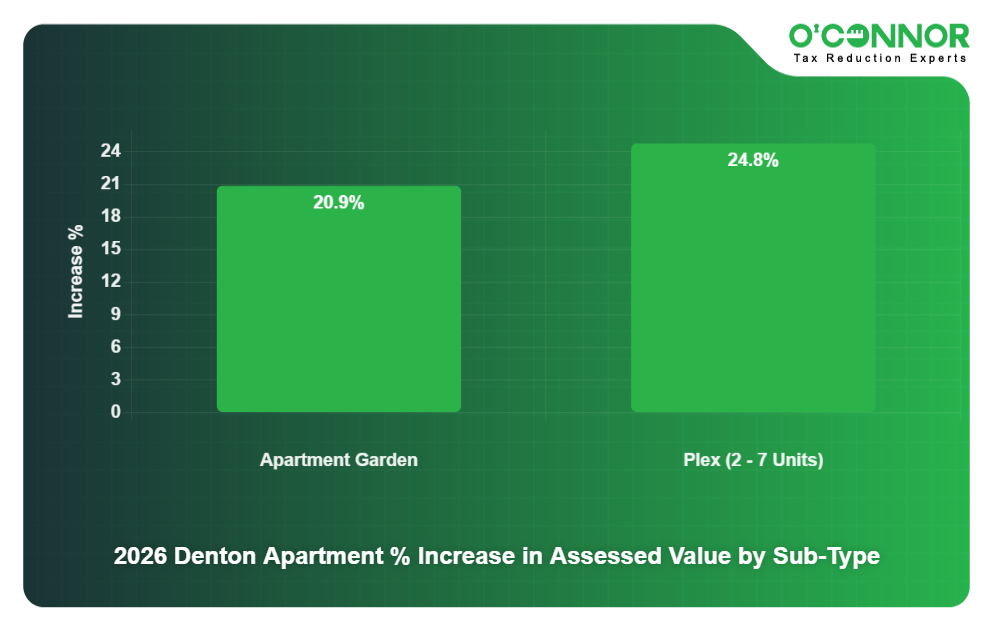
DCAD only broke apartments down into two categories. Garden apartments were responsible for $19.86 billion, following an increase of 20.9%. Plex units contributed $130.23 million following a jump of 24.8%.
Offices Rise by 28.2%
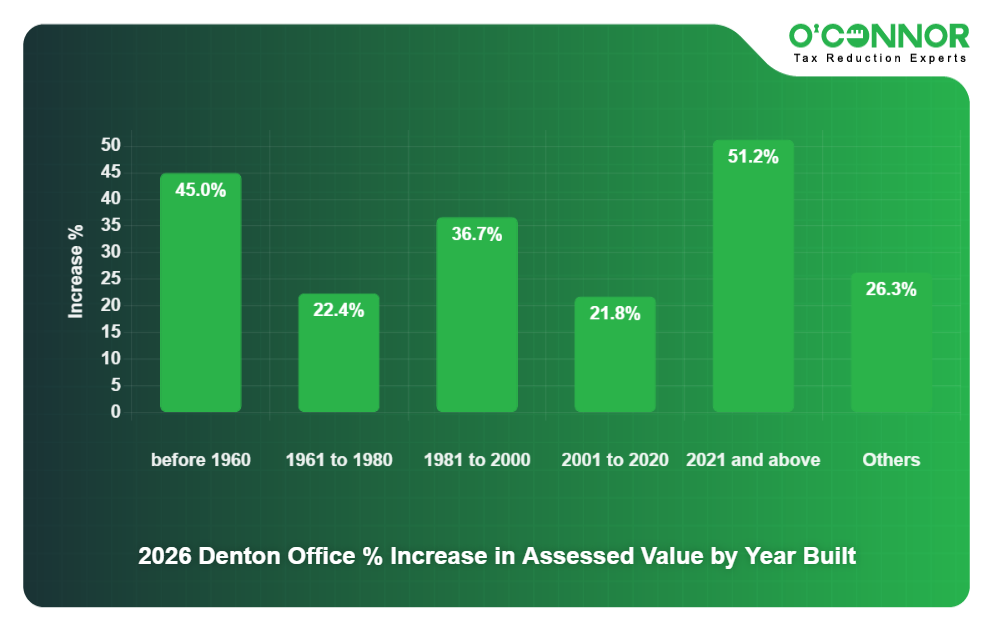
Offices across the nation have struggled since the pandemic, but that has not stopped DCAD from assessing higher values. Offices surged 28.2% in noticed market value in 2026, totaling $2.88 billion. In 2025, offices increased by 29.4%. 50% of all value was built from 2001 to 2020, accounting for $1.61 billion after a jump of 21.8%. Offices built from 1981 to 2000 were in second place with $700.18 million after increasing by 36.7%. New construction soared 51.2% to $315.64 million. Older timeframes saw strong growth, though they contributed less than $250 million combined.
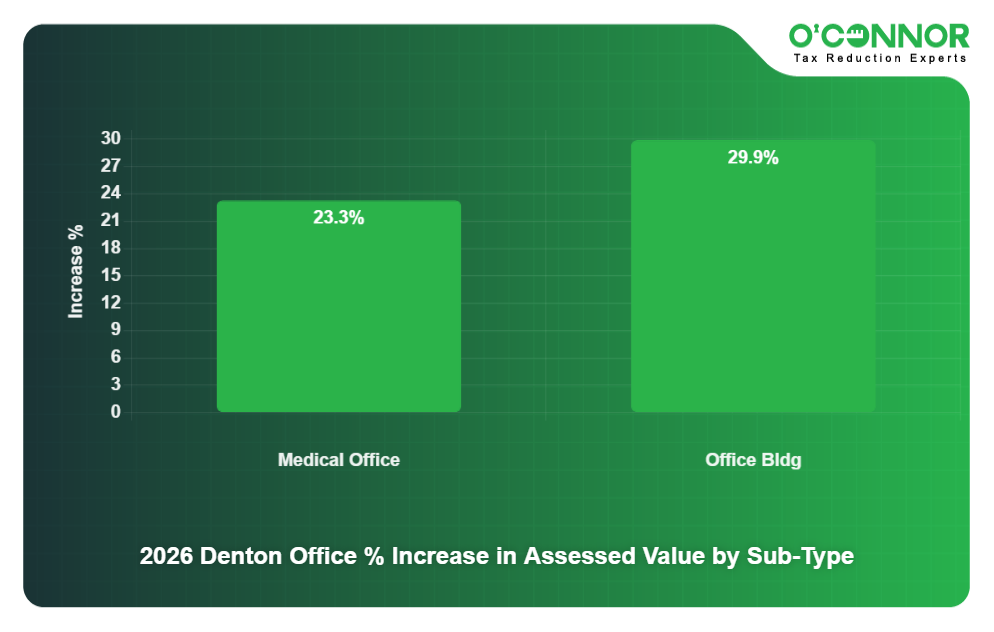
There were only two categories of offices. Office buildings jumped 29.9% to $2.18 billion. Medical offices saw an increase of 23.3%, resulting in a final sum of $698.73 million.
Retail Spaces Expand by 22.4%
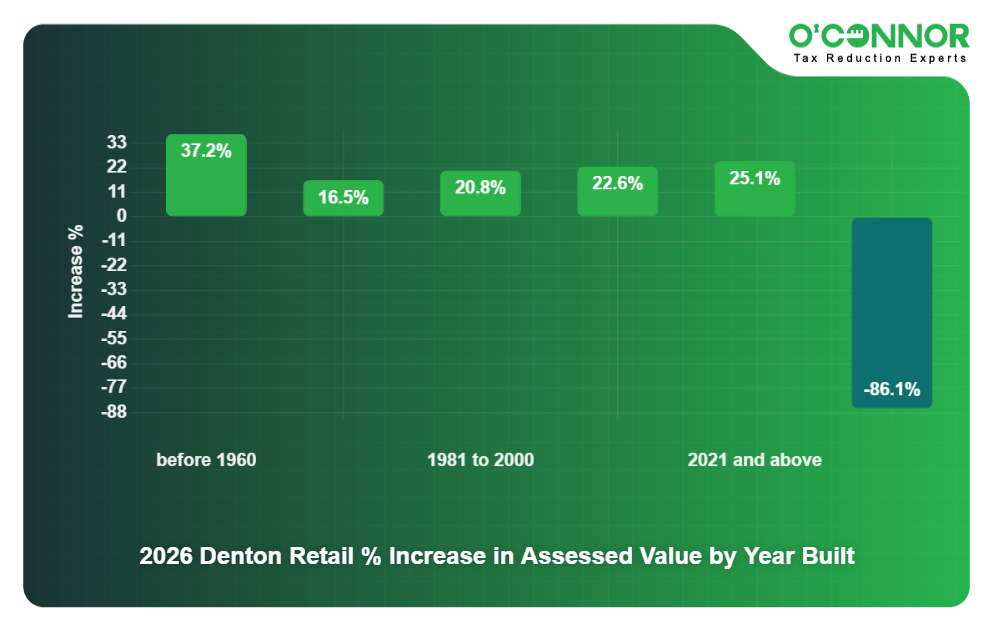
Retail stores recovered from the pandemic and then some, gaining 22.4% in value, reaching a total of $3.83 billion. The time of construction pattern established earlier saw no deviation. 59% of the total was thanks to those built from 2001 to 2020, which translated into $2.27 billion. Those from 1981 to 2000 jumped 20.8% to $843.66 million. New construction added 25.1%, reaching $419.99 million, roughly 11% of the total. The remaining timeframes combined for around 8% of the total.
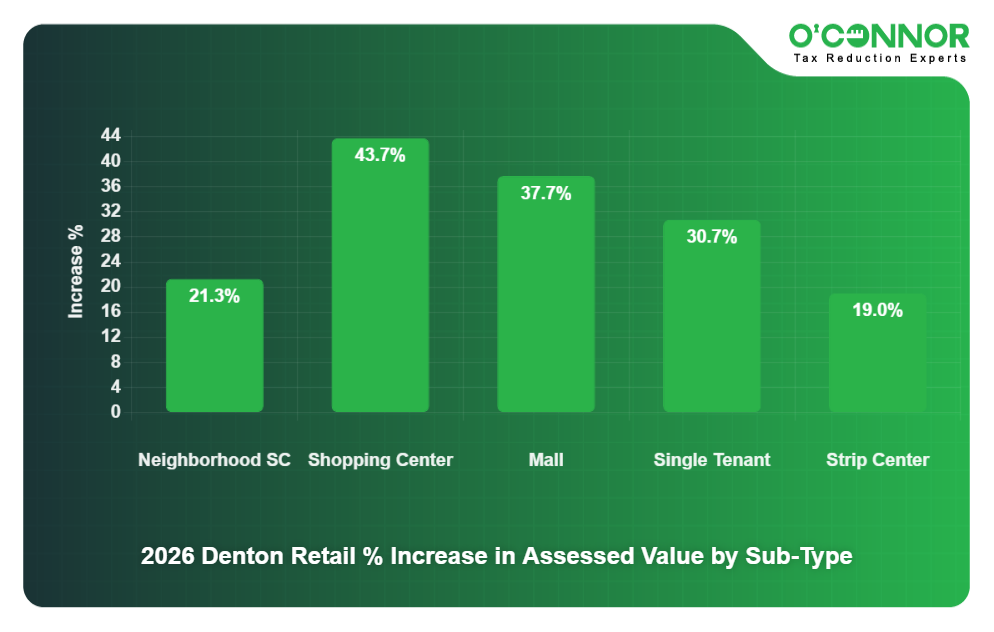
Keeping with Texas tradition, strip centers took a commanding lead after an increase of 19%, resulting in a final tally of $2.16 billion. Neighborhood shopping centers added 21.3% for a final tally of $962.79 million. Shopping centers grew by 43.7%, but only achieved a final number of $1 million. Malls surged 37.7% to $544.12 million. Big box stores grew by 30.7%, but only reached $163.60 million.
Warehouses Combine for Over $1.7 Billion in Value
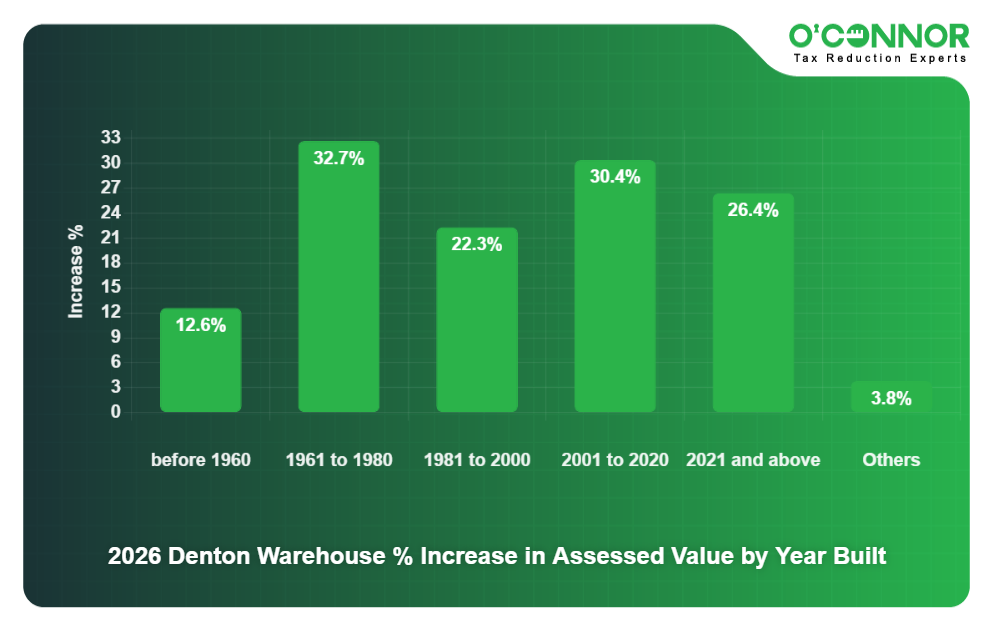
Despite a meteoric rise of 27%, warehouses combined for just $1.7 billion. They followed the same pattern of construction established earlier, with the biggest chunk of value being built from 2001 to 2020. This was $753.46 million following an increase of 30.4%. Those from 1981 to 2000 took second place with $470.64 million. New construction accounted for 23% of the total, jumping 26.4% to $385.78 million. All other timeframes accounted for roughly 6%.
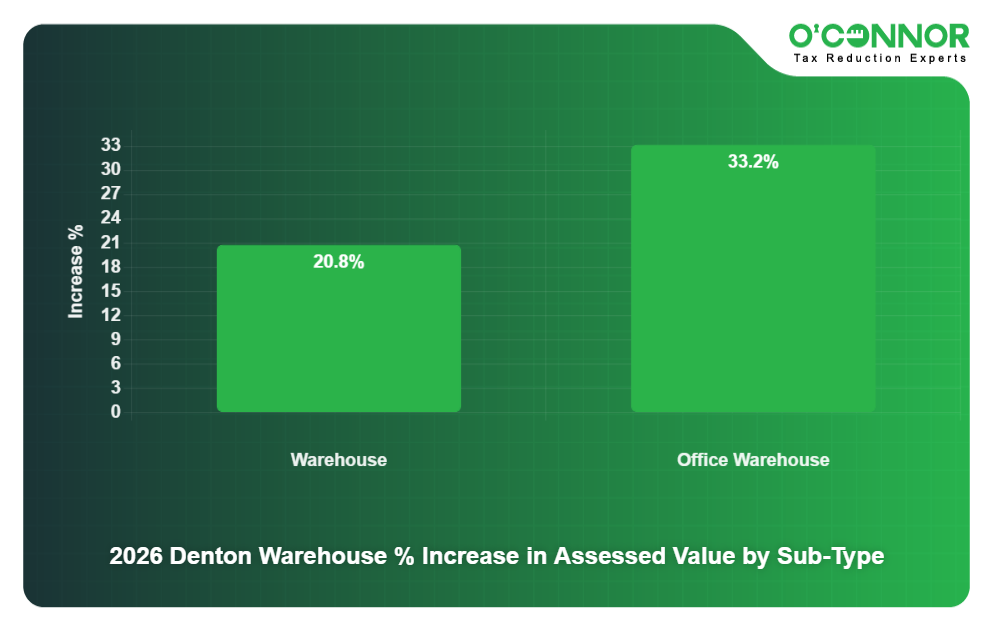
DCAD only used two categories for warehouses. Office warehouses were responsible for $897.82 million, following an increase of one third. Generic warehouses added 20.8% to total $806.43 million.
O’Connor Gets Results with Appeals
People who protested their taxes in Denton County in 2025 saw impressive results. Homeowners saved $154.57 billion in value alone. This was thanks to a record number of people challenging the values set by DCAD. This has been a common occurrence in high-dollar counties, of which Denton certainly is. Appeals and protests not only lower taxable values and fix problems for the individual, but they also force DCAD to make more careful appraisals, which benefits everyone in the community.
We at O’Connor helped clients in Denton get almost double the average savings in 2025, and we are ready to do even better in 2026. Whether you have a business or own a home, we can help you with exemptions, appeals, and cost segregation. The deadline for appeals is May 15, 2026, and once it passes, you lose the ability to protest until the following year. This means now is the time to act, as building a winning protest case requires time, expertise, and evidence. We at O’Connor can help you by doing all of the heavy lifting, including gathering evidence, filing appeals, and representing you at hearings.
Every person who signs up with us gets a client success consultant, who will act as your main point of contact on all issues, rather than a random assortment of customer service representatives. This personal touch enables us to tailor your experience to your needs. In many cases, we can also send out a concierge team directly to your home or business. We can help look for issues, evidence, and other aspects that can help your protest. There is no cost to join, and you will only pay a portion of your savings if we can lower your taxes.